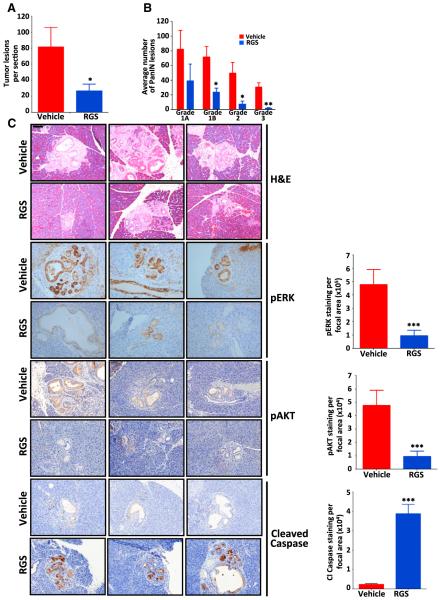
Figure 7. Treatment with Rigosertib Suppresses the Growth of RAS-Driven Pancreatic Intraepithelial Neoplasia.
(A and B) Average number of PanINs per section
(A) and total number of PanINs by grade (B) in vehicle- and RGS-treated animals.
(C) Representative hematoxylin & eosin (H&E) and immunohistochemical staining of representative pancreatic sections harvested from three vehicle- and RGS-treated mice. Scale bar, 100 mm. Average levels of ERK and AKTSer473 phosphorylation and caspase-3 cleavage in PanINs are also represented graphically. All values represent mean ± SD; n ≥ 3 for each treatment group. *p ≤ 0.05; **p ≤ 0.005.
See also Figure S5.

