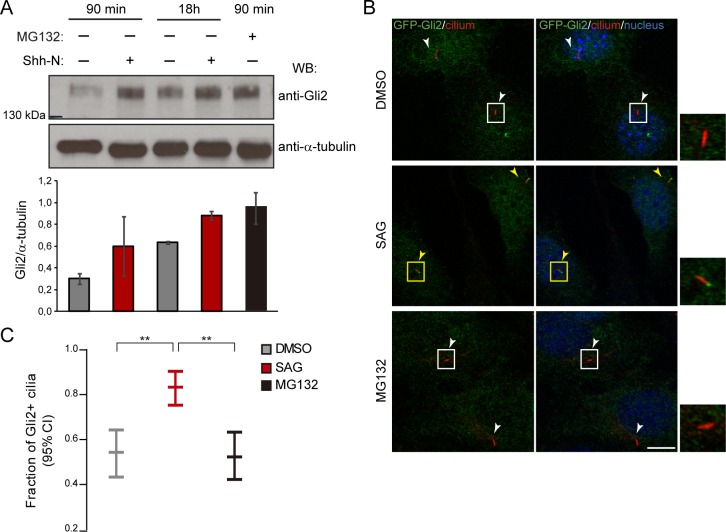
Fig 3. The accumulation of Gli2 at the ciliary tip is not just a consequence of increased proteins levels, but requires activation of the Hh pathway.
(A) WB showing Gli2 levels in control cells, cells stimulated with Shh-N for 90 min or 18 h and cells treated with the proteasome inhibitor MG132 for 90 min. Gli2 levels were normalized against α-tubulin and the graph shows mean ± s.d of biological duplicates. (B) Analysis of Gli2 ciliary localization in transduced NIH/3T3 expressing GFP-Gli2 treated as described in (A). Cells were stained for cilium (anti-Ac.Tub, red), GFP-Gli2 (anti-GFP, green) and nucleus (TOPRO, blue). Small pictures show amplification of the selected region. Yellow and white arrows indicate cilia with or without Gli2 at the ciliary tip respectively. Scale bar: 10 μm. (C) Quantification of Gli2 ciliary localization. Results are expressed as the fraction of cilia that showed Gli2 staining (Gli2+ cilia) with 95% confidence interval (CI). At least 85 cilia were analysed for each sample. ** p<0.001 (hypothesis test for proportions).

