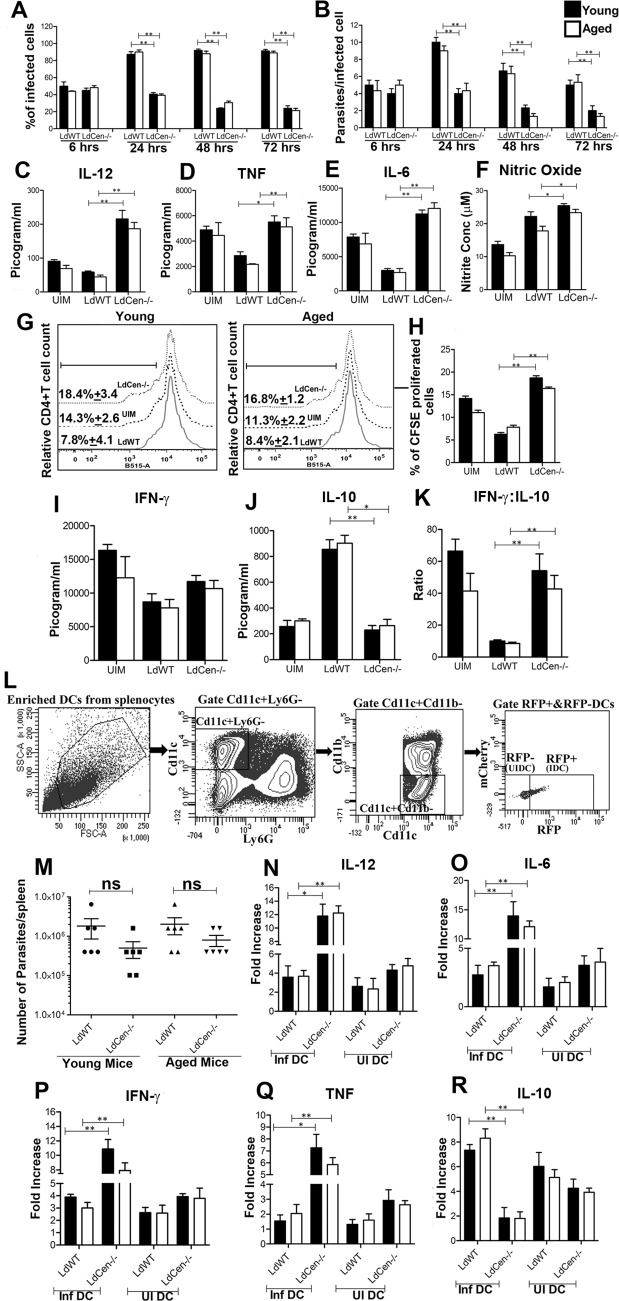
Fig 1. Analysis of young and aged mice derived dendritic cell function upon LdWT and LdCen-/- infection in vitro.
BMDCs isolated from young and aged groups of mice were infected with LdWT or LdCen-/- stationary-phase promastigotes (5:1, parasite to DCs ratio) and intracellular parasite numbers were visualized by Giemsa staining and estimated microscopically at 6, 24, 48 and 72h post-infection. (A) Infection efficiency (% of infected cells) and (B) intracellular growth (parasites per infected cell) were recorded. To measure parasite load in these cultures, a minimum of 300 BMDCs were counted. In a separate experiment BMDCs were infected with parasites and stimulated with LPS (1 μg/ml) for 24h. Culture supernatants were collected to analyze IL-12 (C), TNF (D) IL-6 (E) production by ELISA and NO (F) production by the Griess assay. The data presented are representative of two independent experiments. T cell proliferation and cytokine production upon coculture of parasite-infected BMDCs with OVA-specific transgenic T cells. BMDCs obtained from young and aged BALB/c mice were pulsed with OVA peptide and were either left uninfected or infected with LdWT or LdCen-/- for 24h. CD4+ T cells were purified from age matched young and aged DO11.10 transgenic mice, stained with CFSE and co-cultured with parasite infected BMDCs for 5 days. (G) T cell proliferation was estimated by flow cytometry by studying CFSE dilution of gated CD4+ T cells and represented by the histogram. The staggered histogram overlay displays CD4+T cell proliferation pattern as visualized by CFSE dilution by flow cytometry. Cell proliferation was done in triplicates and histograms representative of mean values were overlaid for figure. The black line on histogram over lay represents % proliferated cells gated in CD4+ T lymphocytes. (H) The bar diagram representing the quantitative CFSE cell proliferation. (I, J) Culture supernatants were collected at day 5 of coculture to assay IFN-γ and IL-10 by ELISA. (K) IFN-γ: IL-10 ratio was determined. The data represent the mean values ± SD of results from 3 independent experiments that all yielded similar results. *p<0.05, **p<0.005. Following enrichment, uninfected splenic DCs (UI DC)/ bystander DCs were sorted from the spleens of different groups of infected mice (n = 6) by gating live single cells for [Cd11c+Ly6G-Cd11b-RFP/m-Cherry-] whereas parasitized splenic DCs (Inf DC) was sorted by gating live single cells for [Cd11c+Ly6G-Cd11b-RFP/m-Cherry+]. Sorting strategy for RFP+ and RFP- DCs is displayed (L). mCherry+ and mCherry- DCs were also sorted using the similar gating strategy. Experiment was repeated 3 times with pooled digest from 6 spleens per experiment. Parasite number in spleen of different groups of infected mice was measured 4 days post-infection (M). Mean and SEM of six mice in each group is shown. The data represent the mean values ± SD of results from 3 independent experiments that all yielded similar results. Sort selected parasitized and uninfected DCs from different groups of young and aged mice were subjected to RNA isolation as mentioned in material and methods section. Isolated total RNA was reverse transcribed and expression levels of different genes were analyzed as described in Material Methods. Normalized expression levels of proinflammatory cytokines IL-12 (N), IL-6 (O), IFN-γ (P) and TNF (Q) and anti-inflammatory cytokine IL-10 (R) were estimated. The data represent the mean values ± SD of results from 3 independent experiments that all yielded similar results.*p<0.05, **p<0.005. Black bar indicates young mice and white bar indicates aged mice. ns = not significant.

