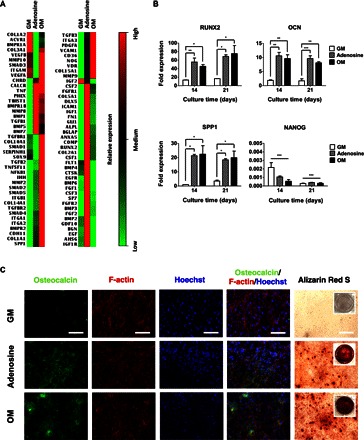
Fig. 1. Exogenous adenosine induced osteogenic differentiation of hiPSCs.

(A) Transcription profile of 84 genes relevant to osteogenesis for hiPSCs cultured for 21 days in growth medium (GM), adenosine-supplemented growth medium (Adenosine), and conventional osteogenic induction medium (OM). Relative expressions: red (high), black (medium), and green (low). (B) Time-dependent quantitative gene expressions of hiPSCs for osteogenic markers (RUNX2, OCN, and SPP1) and pluripotent marker (NANOG) cultured in GM, adenosine, and OM. (C) Immunofluorescence staining of osteocalcin (green), F-actin (red), and nuclei (blue), as well as Alizarin Red S staining of hiPSCs cultured for 21 days in GM, adenosine, and OM. Scale bars, 100 μm. Inset shows the stained image of the entire well. Data are presented as means ± SEs (n = 3). Data are shown as fold expression of target genes after normalization to undifferentiated, pluripotent hiPSCs. For RUNX2, OCN, and SPP1, the groups with various medium conditions at the same culture time were compared by using one-way analysis of variance (ANOVA) with Tukey-Kramer post hoc test. For NANOG, all the groups were compared to undifferentiated, pluripotent hiPSCs by two-way ANOVA with Bonferroni post hoc test. Asterisks were assigned to P values with statistical significances (*P < 0.05; **P < 0.01; ***P < 0.001).
