
FIGURE 2:
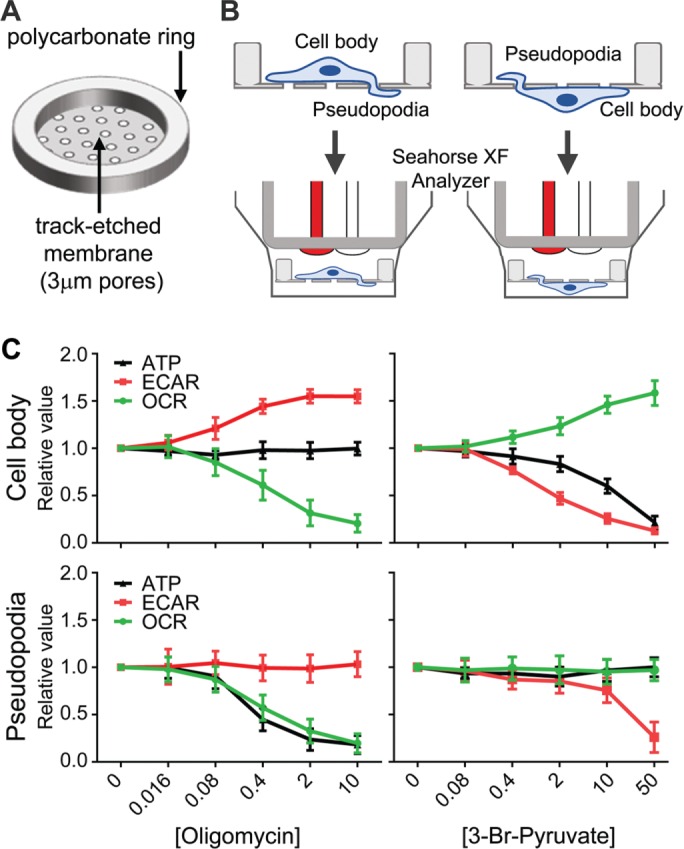
Mitochondria drive pseudopodial metabolism and ATP production—subcellular reversal of the Warburg effect. (A, B) Schematic of custom culture insert and its use for distinct metabolic analysis of cell bodies and pseudopodia. A thin membrane with track-etched 3-μm pores was cut to size and bonded to polycarbonate support rings using a laser cutter (see Materials and Methods for details), forming mini–Transwell-like culture inserts compatible with the Seahorse XF24 metabolic analyzer. Cells can be cultured on the obverse or converse of the inserts and induced to form pseudopodia through to the opposite side, allowing metabolic analysis of cell bodies or pseudopodia. (C) Metabolic analyses of glycolysis (measured by ECAR), mitochondrial oxidative phosphorylation (measured by OCR), and ATP in cell bodies and pseudopodia as a function of increasing concentration of oligomycin to inhibit mitochondrial function or 3-bromopyruvate to inhibit glycolysis (n = 6; average values [relative to untreated conditions] ± SD).