. 2016 Aug 31;5:e14589. doi: 10.7554/eLife.14589

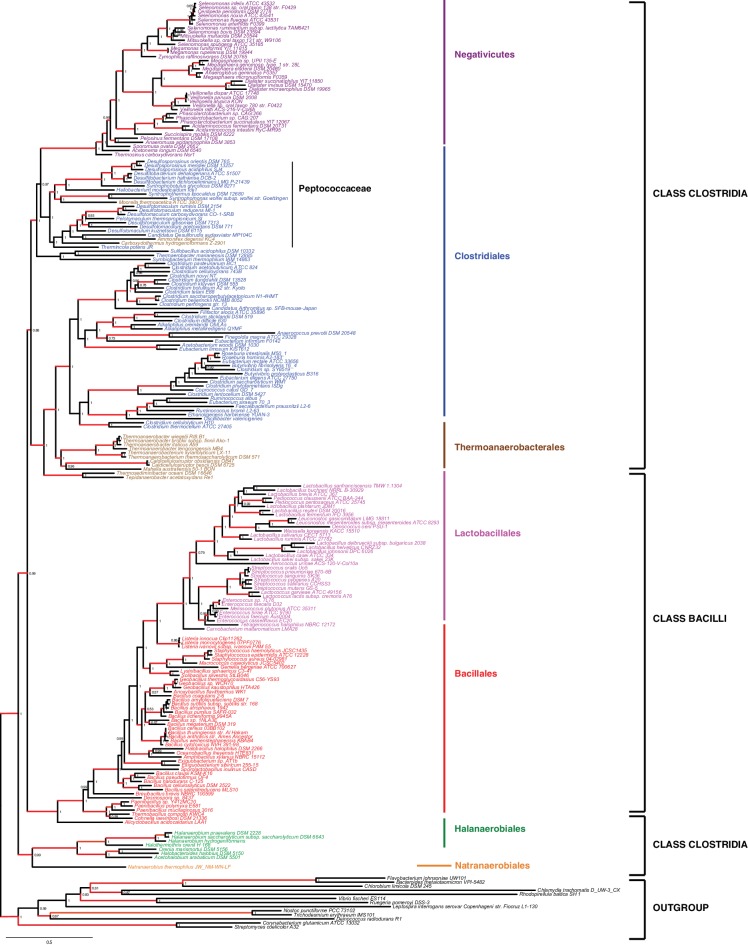
Figure 2. Phylum-level phylogeny of the Firmicutes.

Bayesian phylogeny of the Firmicutes based on a concatenation of 47 orthologous ribosomal proteins comprising 5551 amino acid positions and the CAT+GTR+Γ4 model. Values at nodes represent Bayesian posterior probabilities. The scale bar represents the average number of substitutions per site. For details on analyses, see Materials and methods.

DOI: http://dx.doi.org/10.7554/eLife.14589.004

Figure 2.

Figure 2—figure supplement 1. Results of IC congruence test for the 47 ribosomal proteins.

Figure 2—figure supplement 1.

IC values were mapped onto the ribosomal protein concatenation phylogeny shown in Figure 2. Branches in red indicate congruence among markers according to IC tests. Raw results of the test are provided as Additional Data in Dryad (Antunes et al., 2016).
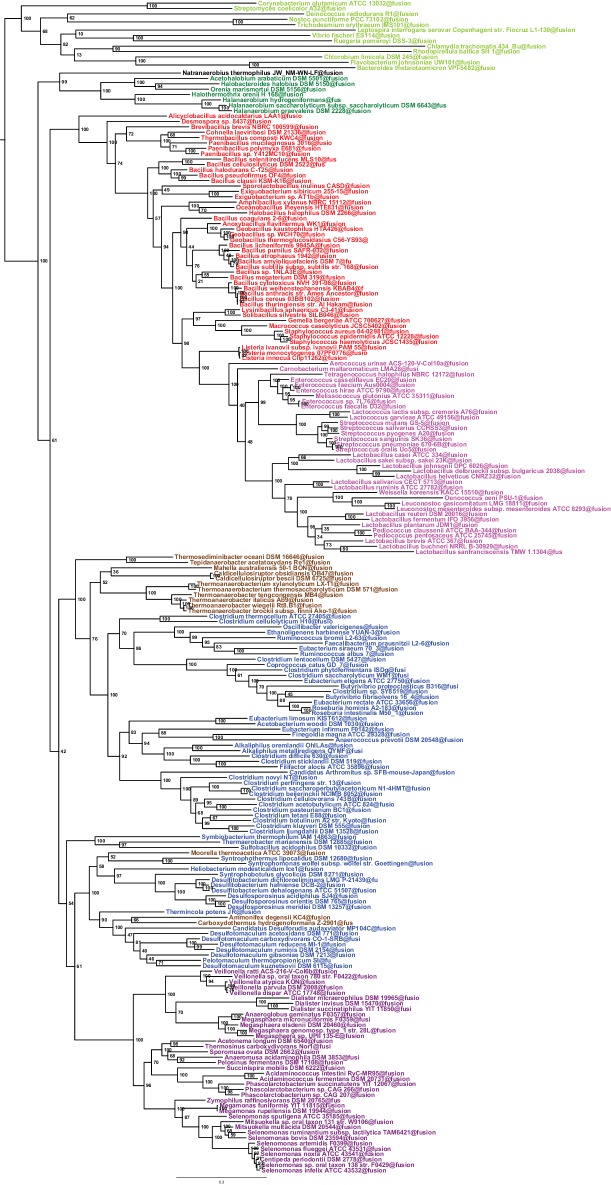
Figure 2—figure supplement 2. Maximum likelihood phylogeny of the Firmicutes.

Figure 2—figure supplement 2.

The tree was obtained by PhyML 3.0 based from the same concatenation of 47 orthologous ribosomal proteins as the Bayesian tree in Figure 2 and the LG+Γ4 model. Values at nodes represent non-parametric bootstrap values calculated on 100 replicates of the original dataset. The scale bar represents the average number of substitutions per site.
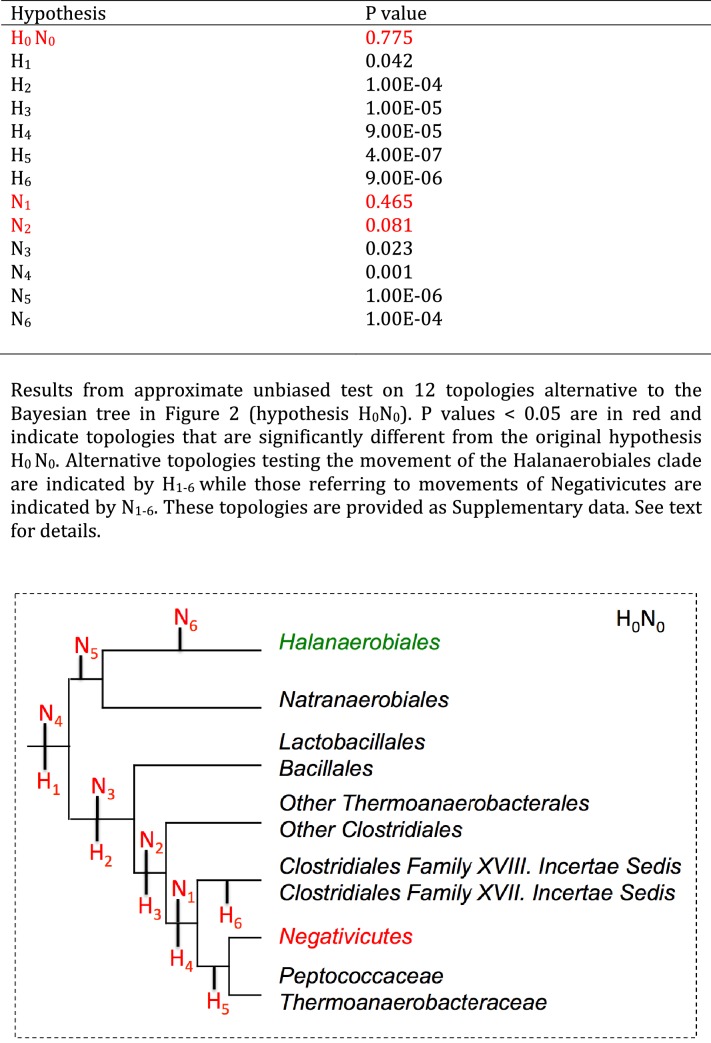
Figure 2—figure supplement 3. Results of AU test for 12 alternative topologies.

Figure 2—figure supplement 3.

Full results of the test are provided as Additional Data in Dryad (Antunes et al., 2016).