
Figure 2.
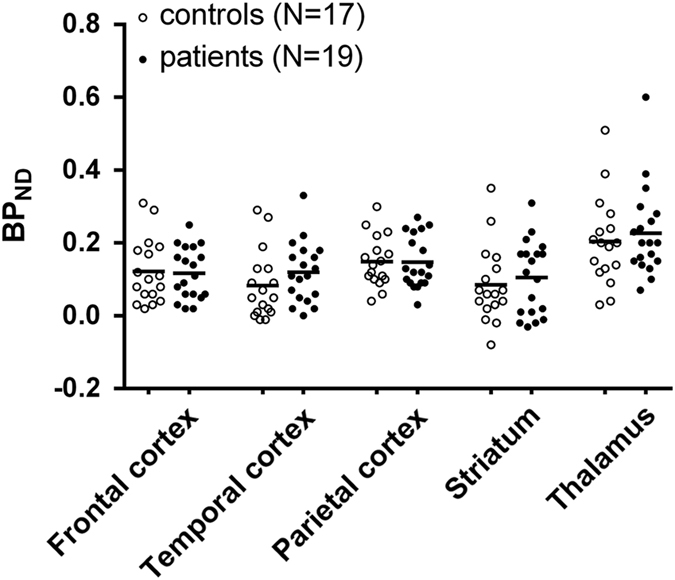
Scatterplot showing individual binding potential (BPND) values in each of the studied regions of interest (frontal cortex, temporal cortex, parietal cortex, striatum, and thalamus). No significant differences were found between patients with a recent onset psychotic disorder (black dots) compared with healthy controls (white dots). Bars indicate mean group BPND values.