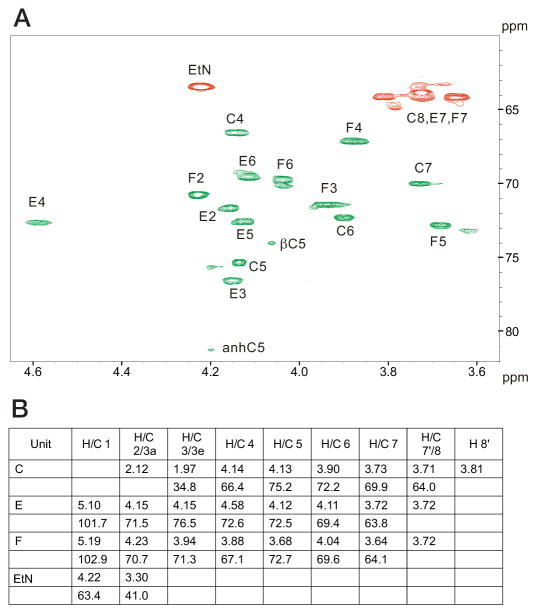
FIGURE 4. NMR chemical shift assignments of truncated E. coli O157:H7 LPS.
Assignment of the HSQC correlation spectrum for the core oligosaccharide. Cross-peaks marked in green refer to CH groups, whereas those marked in red refer to CH2 groups (A). 1H and 13C NMR chemical shift values (δ, ppm) are shown for the core oligosaccharide (B).

