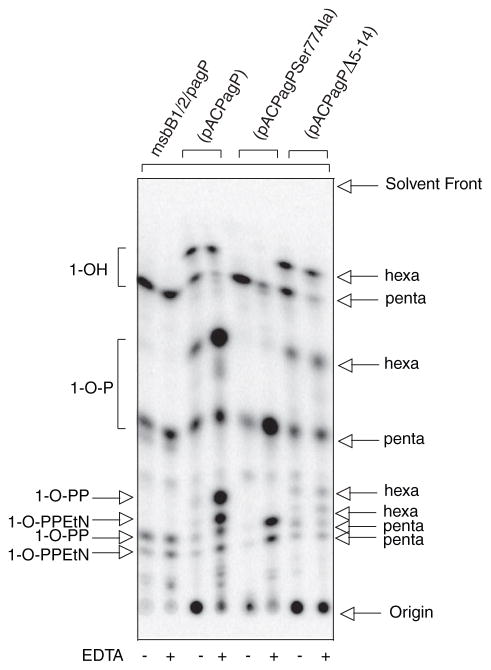
FIGURE 6. TLC analysis of 32P lipid A profiles after mild acid hydrolysis.
Lipid A was labeled with 32Pi and isolated from cells by mild acid hydrolysis as described in the legend to Fig. 2. In this figure, hexa refers to the 3 + 3 acyl chain distribution.

