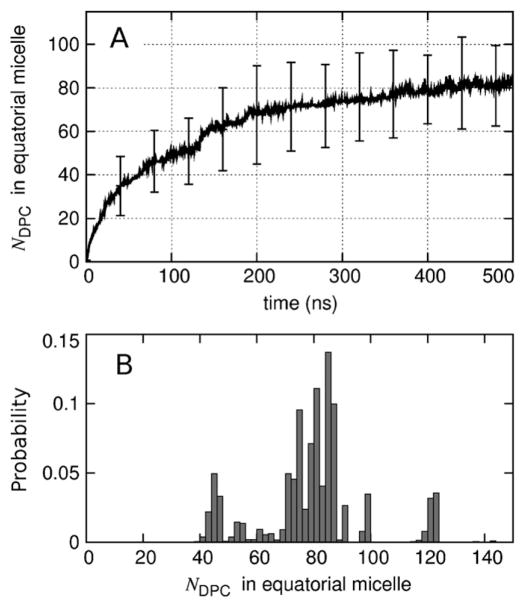
Fig. 10.
Number of detergents in the equatorial micelle surrounding each molecule of PagP. (A) Time-evolution of the average. Vertical bars represent the standard deviation among 24 molecule of PagP at selected timepoints. (B) Histogram of the data from the last 145 ns of each simulation (bin with of 2 molecules).

