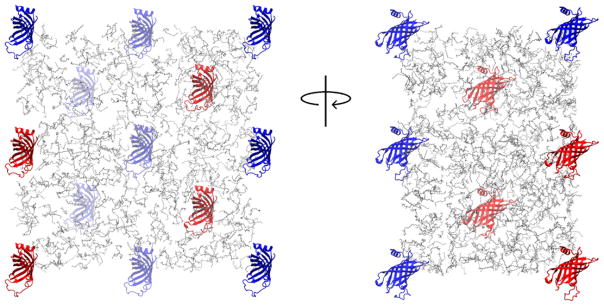
Fig. 2.
One of 6 initial conformations of the simulation system. Four molecules of PagP are shown as red cartoons and periodic images are shown in blue. Detergent molecules are shown as gray lines. Water molecules and ions are omitted for clarity. For interpretation of the references to color in this figure legend, the reader is referred to the web version of the article.

