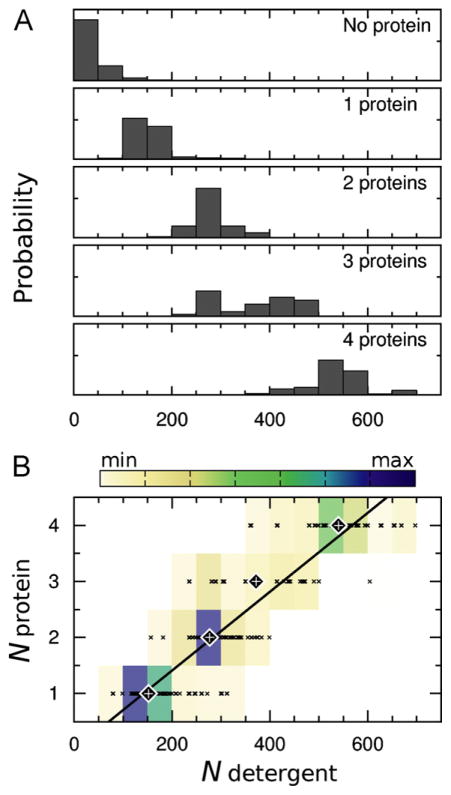
Fig. 8.
Number of detergent molecules in aggregates with different numbers of protein molecules. (A) Probability distributions. (B) Heat map of the data presented in part A. The data points that were used to construct the heat map are shown as × symbols. Large diamonds with plus signs in the middle mark the average number of detergent molecules for each number of proteins per aggregate. A line of best fit to these average values, computed with gnuplot (Williams and Kelly, 2012), is superimposed on the heat map.

