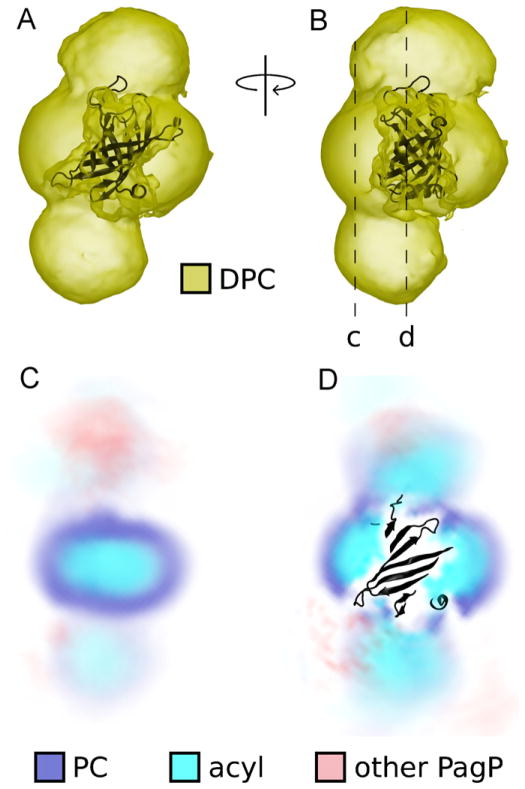
Fig. 9.
Distribution of detergent and other protein atoms around a central molecule of PagP. (A, B) Spatial distribution function (SDF) of DPC detergents shown as a yellow isodensity surface around a black cartoon representation of PagP. The SDF was obtained from all 4 protein molecules in the last 145 ns of all 6 simulations. (C, D) Two slices through the SDF. Darker color represents increased time- and ensemble-averaged sampling density for (blue) phosphocholine (PC) detergent headgroups, (cyan) acyl chains, and (red) other protein molecules. For interpretation of the references to color in this figure legend, the reader is referred to the web version of the article.

