
Figure 3.
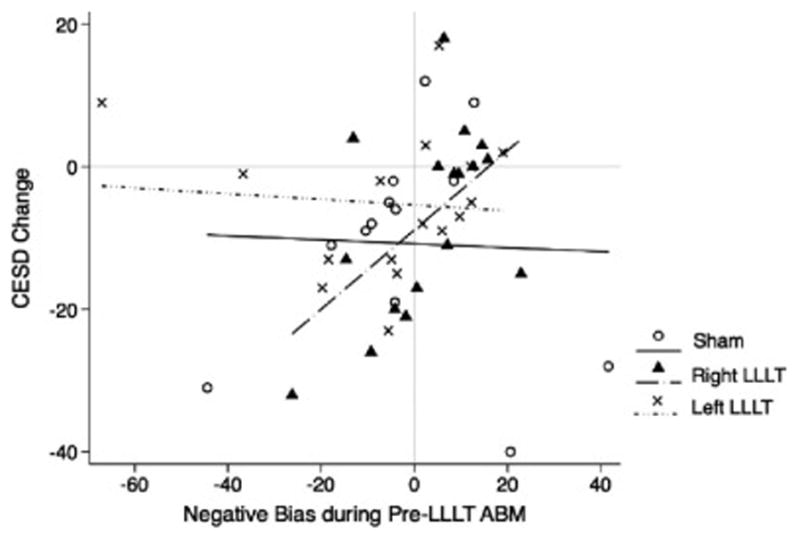
Interaction between LLLT condition, negative bias during pre-LLLT ABM, and mood change
Note: All presented models used time as a predictor in the interaction. However, for the sake of clarity, figures 3 and 4 use CES-D change (CES-D score at 2 week follow-up minus baseline CES-D) in order to represent the effect of time on mood.