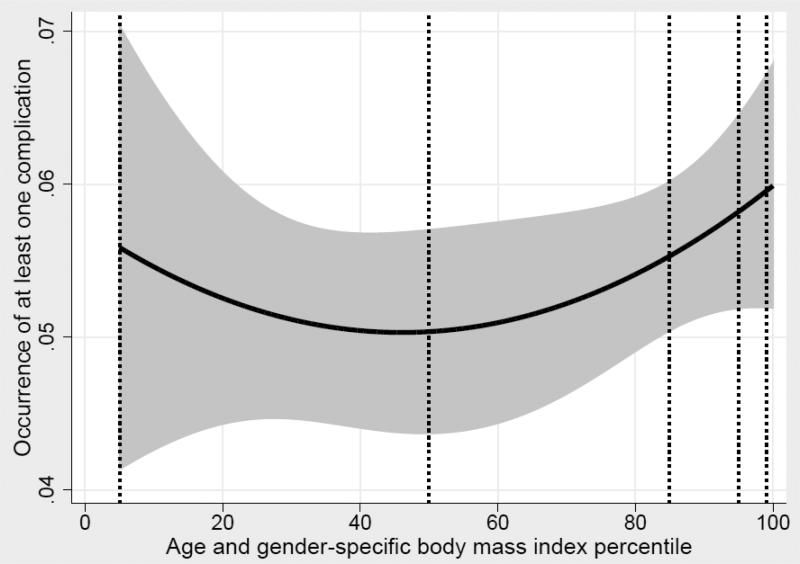
Figure 1. Association between BMI percentile as a continuous variable, and occurrence of any complication among appendectomy patients.
A quadratic line of best fit was applied and is demonstrated, with 95% confidence intervals denoted by the shaded gray region. The association between any complication and the square of BMI percentile is statistically significant, with a P value of 0.03. Vertical dashed lines denote the 50th percentile as well as the BMI category cutoff points used in this study of 5th percentile, 85th percentile, 95th percentile and 99th percentile.

