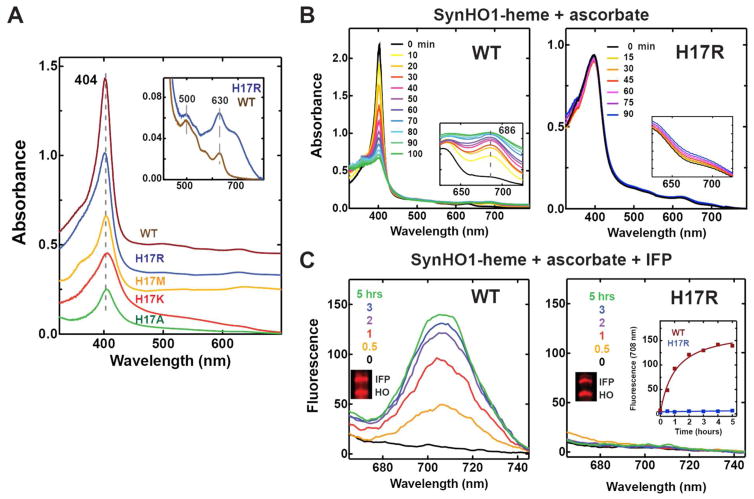
Figure 6. UV-Vis absorbance spectra and HO activity assays with purified SynHO1-heme complexes.
(A) UV-Vis absorbance spectra of 20 μM purified SynHO1-heme complexes. Inset shows a y-axis expansion for the WT and H17R spectra. (B) Time-dependent (min.) UV-Vis absorbance changes for 20 μM WT and H17R SynHO1-heme complexes after addition of 10 mM ascorbate and 1 μM catalase. (C) Time-dependent (min.) fluorescence emission spectra for 20 μM WT and H17R SynHO1-heme complexes after addition of 10 mM ascorbate, 1 μM catalase, and 20 μM apo IFP. The inset is a plot of the fluorescence intensity at 708 nm as a function of time for WT and H17R.

