
Figure 3.
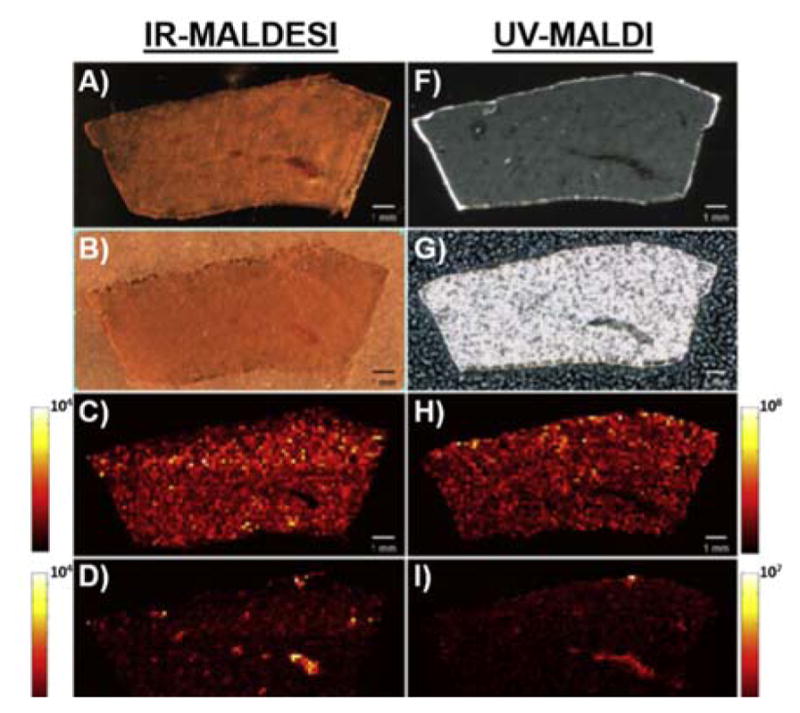
Comparison of MALDI and IR-MALDESI MSI analysis of serial sections from a lapatinib dosed liver. A,F) optical images of the analysed tissue, B,G) image of tissue with matrix applied C,H) lapatinib D,I) heme b E,J) colocalization of lapatinib (blue) and heme b (red) in a single MS image. Reproduced from Ref. 41 with permission from Elsevier.