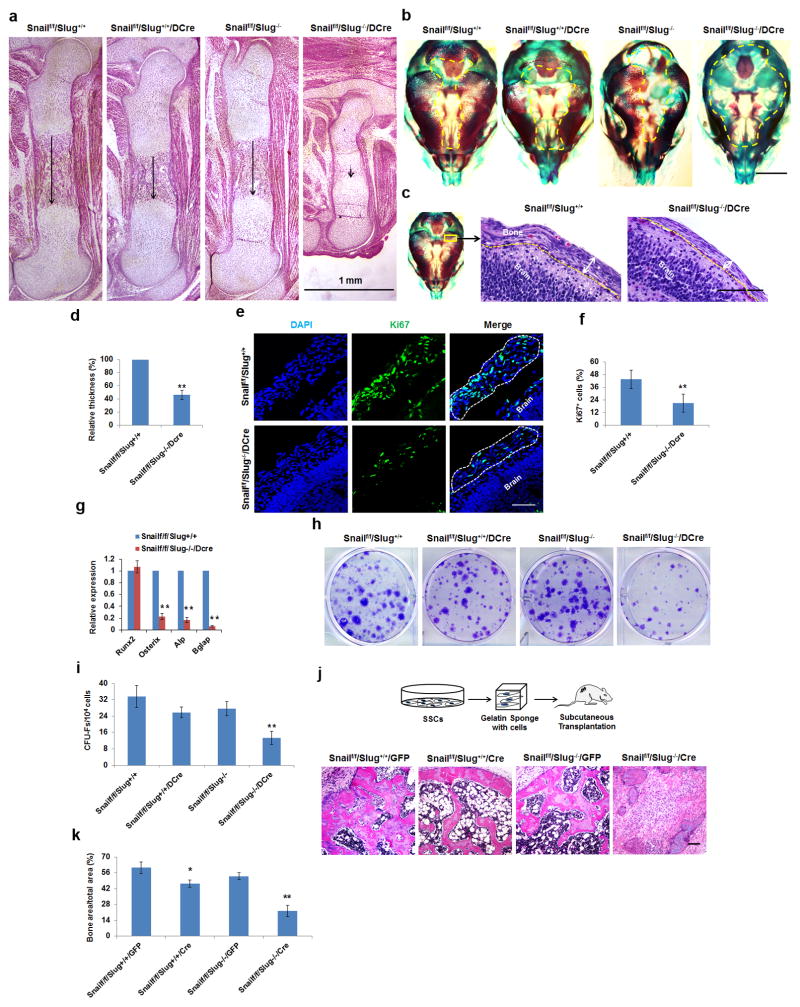
Figure 2. Skeletal and SSC-Associated Defects in Snail/Slug-Targeted Mice.
(a) Femur histology of E17.5 Snailf/f/Slug+/+, Snailf/f/Slug+/+/Dermo1-Cre Snailf/f/Slug−/− and Snailf/f/Slug−/−/Dermo1-Cre embryos. Scale bar: 1 mm. Results are representative of 5 experiments performed.
(b) Alizarin Red/Alcian Blue staining of skulls isolated from E17.5 Snailf/f/Slug+/+, Snailf/f/Slug+/+/Dermo1-Cre, Snailf/f/Slug−/− and Snailf/f/Slug−/−/Dermo1-Cre embryos. Scale bar: 500 μm. Results are representative of 5 experiments performed.
(c) Histology of E15 Snailf/f/Slug+/+ and Snailf/f/Slug+/+/Dermo1-Cre skulls across the parietal area. Scale bar: 100 μm. Results are representative of 5 experiments performed.
(d) Relative thickness of skull mesenchymal cell layers from (c) (mean ± s.d., n=5 mice). **p<0.01; unpaired t-test.
(e) Ki67 Immunofluorescence of parietal suture mesenchymal cell layers from E15 Snailf/f/Slug+/+ and Snailf/f/Slug−/−/Dermo1-Cre skulls. Scale bar: 25 μm. Results are representative of 4 experiments performed.
(f) Quantification of Ki67-positive cells from (e) (mean ± s.d., n=4 mice). **p<0.01; unpaired t-test.
(g) Relative mRNA expression of osteogenic markers in E17.5 calvarial RNA extracts from Snailf/f/Slug+/+ versus Snailf/f/Slug−/−/Dermo1-Cre embryos (mean ± s.d., n=5 mice). **p<0.01; unpaired t-test.
(h) CFU-F generation from bone marrow cells isolated from E18.5 Snailf/f/Slug+/+, Snailf/f/Slug+/+/Dermo1-Cre, Snailf/f/Slug−/− and Snailf/f/Slug−/−/Dermo1-Cre mice. Results are representative of 5 experiments performed.
(i) CFU-F colony counts from (h) (mean ± s.d., n=5 mice). **p<0.01; one-way ANOVA.
(j) Schematic of the overall experimental design for in vivo implantation (upper panels).The lower panels show histology of tissues isolated from nude mice transplanted with Snailf/f/Slug+/+/GFP or Snailf/f/Slug−/−/Cre SSCs. Results are representative of 3 performed. Scale bar: 100 μm.
(k) Quantification bone formation in tissues from (j) (mean ± s.d., n=3 mice). **p<0.01, *p<0.05; one-way ANOVA.

