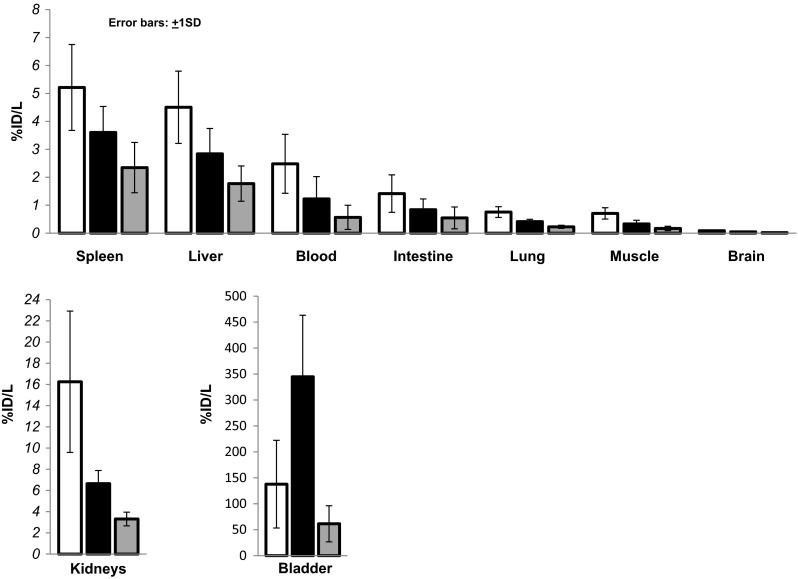
Fig. 3.

Biodistribution data of [68Ga]NODAGA-RGD from major organs and tissue. Mean percentage injected radioactivity per liter is given (%ID/l). Data are extracted from the three static PET scans corrected for decay. White bar = 8 ± 2 min p.i.; black bar = 37 ± 3 min p.i.; gray bar = 75 ± 4 min p.i. Due to the great differences of the determined values, three different y-axes are included
