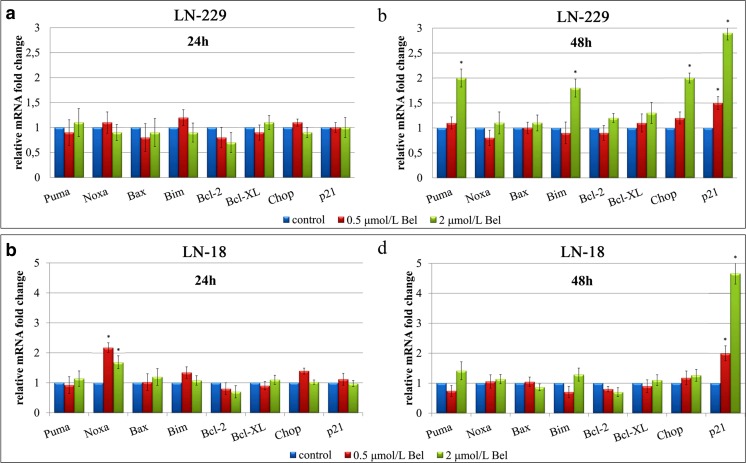
Fig. 7.
Relative quantification of gene expression in glioblastoma cells. Cells were treated with 0.5 and 2 μmol/L of Bel, and RNA was extracted from LN-229 cells cultured for 24 h (a) or 48 h (b); and LN-18 cells cultured for 24 h (c) or 48 h (d). Results are shown as a relative fold change in mRNA expression in comparison to untreated controls, where expression level was set as 1. Statistical significance was considered if * p < 0.05

