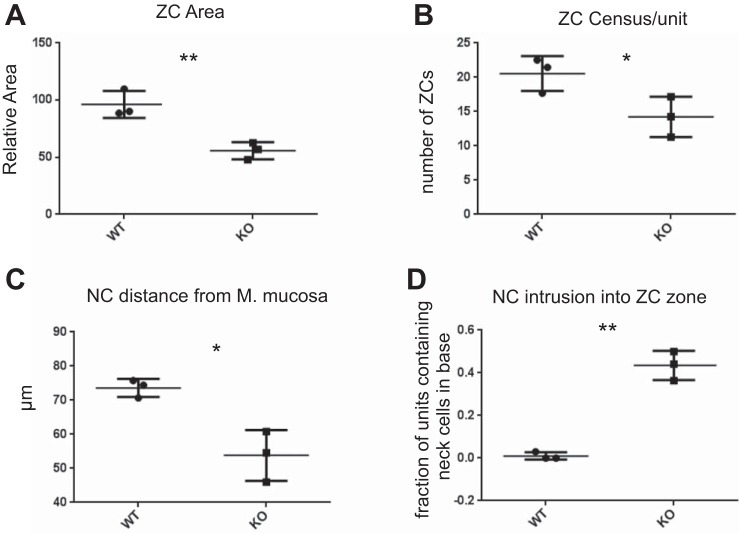
Fig. 5.
Quantification of histological data from n = 3 biological replicates. A: ZC size (measured as pixels per cell), normalized to control (WT). B: number of ZCs per unit. C: distance between the mucous neck cell (NC) nearest the base of the gastric unit (i.e., the muscularis mucosa basement membrane) and the base of the unit. D: the mean fraction of units per mouse containing mucous neck cells in the base regions where ZCs reside. *P < 0.05, **P < 0.01 by one-tailed t-test, unequal variance; data expressed as mean from each mouse + range of all 3 mice.

