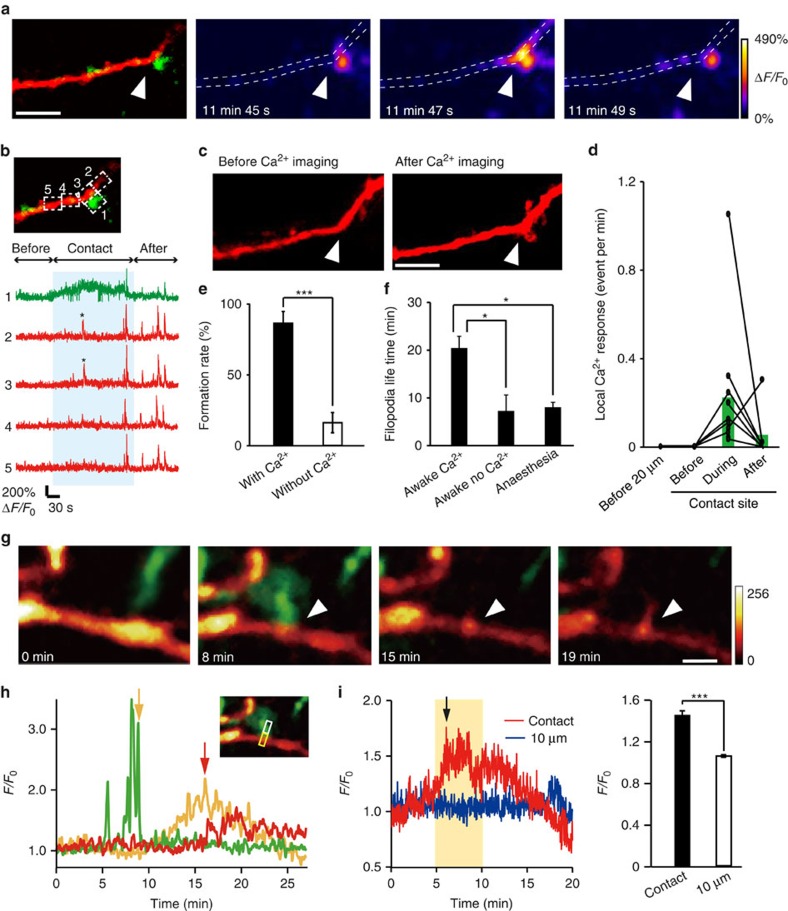
Figure 2. Local dendritic Ca2+ elevation and actin accumulation may mediate microglia-induced filopodia formation.
(a) Ca2+ imaging in awake mouse in vivo. Left panel shows a dendrite (red) with a microglia (green) contact point indicated by the white arrow head. Subsequent panels show Ca2+ fluorescence at different times during the same microglia–dendrite contact. The white dotted line indicates the dendrite outline. (b) Upper left panel shows the same dendrite (red) and microglia (green) contact as in a and indicates the ROIs used to quantify the spatial and temporal aspects of Ca2+ elevation shown in the corresponding five traces in the right panel. The blue shading indicates the duration of the microglia–dendrite contact, which induced brief Ca2+ transients (indicated by asterisk) in ROIs 2 and 3, and a smaller sustained elevation in the microglial process (ROI 1). (c) Z-stacked images of the same dendrite before the Ca2+ imaging and transients were observed and following Ca2+ imaging. Arrowheads indicate microglia contacted point. Scale bar, 5 μm. (d) Local dendritic Ca2+ responses were exclusively associated with microglial contact. At dendritic contact sites, Ca2+ transients were absent before the contact, increased in frequency during the contact and typically decreased back towards zero after the contact. At dendritic locations 20 μm adjacent to the contact points, no localized Ca2+ responses were observed throughout the same imaging periods (20 μm n=3, before contact n=4, during contact n=11, after contact n=7 dendrites in 8 mice). (e) Averaged filopodia formation rates in dendrites in which microglial contact was associated with a Ca2+ transient compared with those dendrites in which there was no Ca2+ response-associated microglia contact (unpaired t-test, error bars are mean ±s.e.m., exact P-value is P=0.00006; with Ca2+: n=7 animals, without Ca2+: n=16 animals). (f) Lifetime of filopodia formed after microglial contact to dendrites in which a Ca2+ response was observed and in those in which microglial contact was not associated with a dendritic Ca2+ transient. These experiments were conducted in awake mice and are compared with lifetimes of filopodia arising after microglial contact in dendrites of anaesthetized mice (one-way ANOVA, post-hoc Bonfferoni test, error bars are mean ±s.e.m., exact P-values are P=0.002 (awake Ca2+, awake no Ca2+), P=0.0003 (awake Ca2+, anaesthesia), P=1 (awake no Ca2+, anaesthesia); awake Ca2+: n=7, awake no Ca2+: n=5, anaesthesia: n=16 dendrites). (g) Time-lapse in vitro imaging of actin accumulation after microglia contact with a dendrite in a cortical slice culture transfected with pCMV-lifeact-mCherry. Arrowhead indicates microglia contact point. mCherry colour intensity scale shown in arbitrary units; green, microglia. Scale bar, 2 μm. (h) Quantification of the time course of fluorescence changes for the images illustrated in G (microglia, green; lifeact-mCherry, yellow; filopodia, red). The inset shows the ROI used to quantify fluorescence (white box for microglia process and dendritic filopodia, yellow box for actin accumulation). Yellow arrow indicates end of the microglia contact. Red arrow indicates start of filopodia formation. (i) Left: representative time course of normalized lifeact-mCherry fluorescent intensity changes within the dendrite at a microglia contact site (red) and at an adjacent dendritic site 10 μm from the contact point (blue). Black arrow indicates onset of filopodia formation. Right: averaged fluorescent intensity values from 5 to 10 min after microglia contact at contact sites was significantly increased compared with that at adjacent sites 10 μm from the microglia contact points during the same time period (right) (paired t-test, error bars are mean ±s.e., exact P-value is P=0.0003; n=6 sites).

