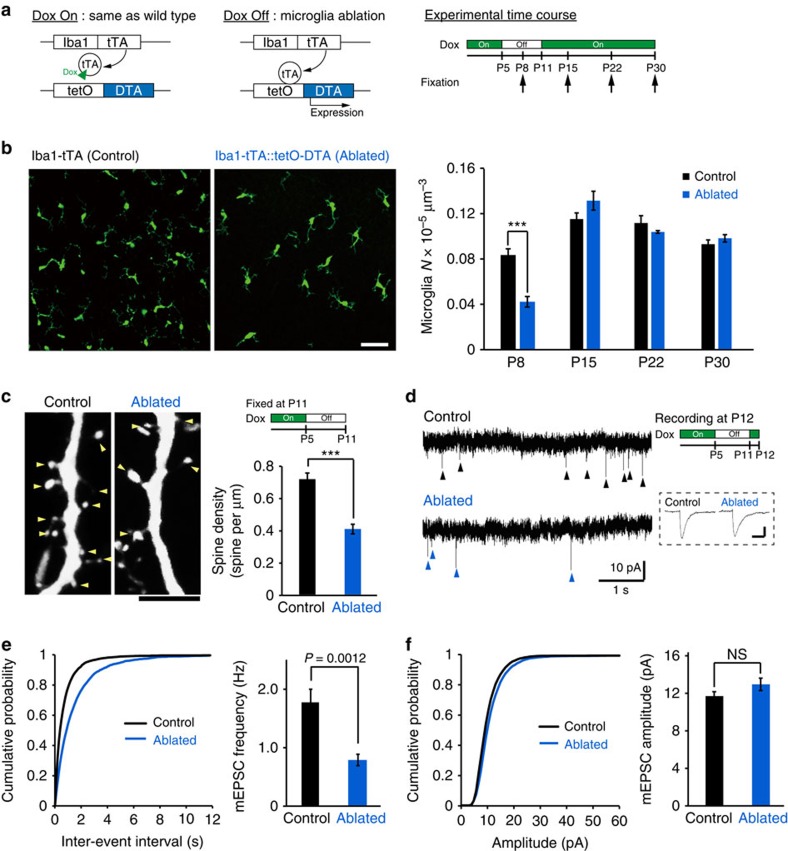
Figure 4. Microglia ablation reduces the number of functional synapses.
(a) Left panel: schematic of the ablation strategy used to reduce microglia by transient withdrawal of dietary Dox. Arrows in the right panel indicate brain fixation times for microglial histology. (b) Sample fluorescent images from P8 mice (left) and averaged data (right) showing reduced Iba1 (microglia) immune reactivity in P8 Iba1-tTA::tetO-DTA transgenic mice following Dox withdrawal from P5 to P10, as compared with the Iba1-tTA mice (control) at P8. Scale bar in left panel, 50 μm. The recovery of microglial density by P15 (right panel) is noteworthy (unpaired t-test, error bars are mean ±s.e.m.; P8: exact P-value is P=9.3E−5, P15: exact P-value is P=0.15, P22, exact P-value is P=0.27, P30: exact P-value is P=0.33; P8: (control n=6, ablated n=8 animals), P15: (control n=4, ablated n=4 animals), P22: (control n=4, ablated n=4 animals), P30: (control n=4, ablated n=4 animals)). (c) Typical images of dendritic spines (yellow arrowheads) in L2/3 pyramidal neurons from control (left) and microglia-ablated mice (right). Scale bar, 5 μm. The mean spine density (right panel) was significantly reduced in microglia-ablated mice (unpaired t-test, error bars are mean ±s.e.m.; exact P-value is P=6.26E−5; Control n=7, Ablated n=6 animals). (d) Representative current traces from voltage-clamped L2/3 pyramidal neurons from P12 control and microglia-ablated mice, 6 days after Dox withdrawal, as indicated by the upper right experimental schematic. Arrowheads indicate mEPSCs. Inset indicates averaged (n∼10) mEPSCs from each condition. Scale bar, 5 pA, 10 ms. (e) Typical cumulative mEPSC frequency (e, left) and amplitude (f, left) distributions from a control and microglia-ablated mouse. Accompanying bar graphs show averaged date for mEPSC frequency (e, right) and mEPSC amplitude (f, right). Mean frequency was significantly reduced by transient microglia ablation (unpaired t-test, error bars are mean ±s.e.; exact P-values are P=0.0012 (e, right), P=0.14 (f, right); Control n=10 neurons from 5 animals, Ablated n=9 neurons from 3 animals).

