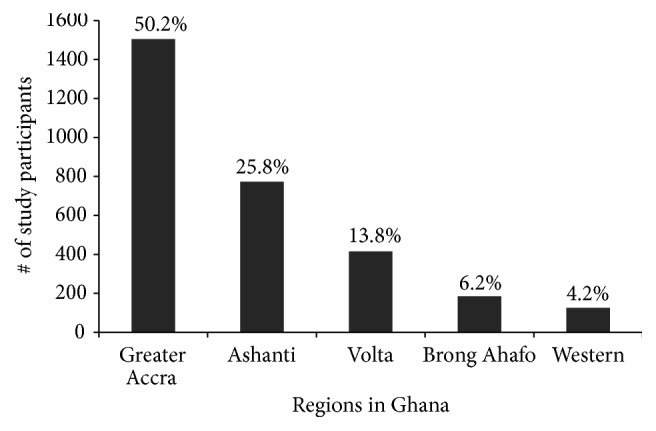
Figure 1.

Population distribution of study participants by region. The 3000 female participants in the study were selected based on population density of the region, willingness of participants, and accessibility to treatment facilities for referrals. Percentages shown here were calculated as a fraction of participants in every region over total number of participants recruited.
