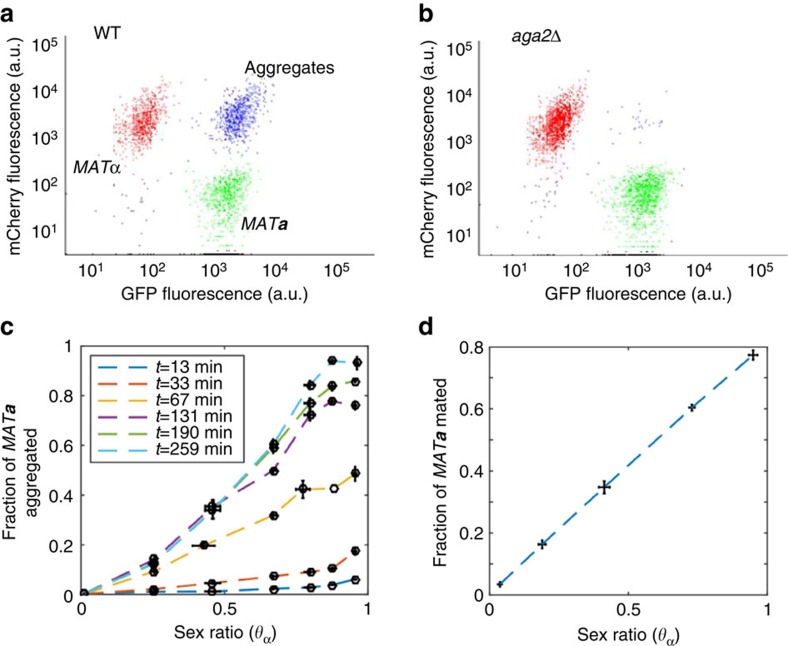
Figure 3. Efficiencies of sexual aggregation and mating exhibit linear dependence on the sex ratio.
(a) Upon co-incubation in suspension, subpopulations of sexually aggregated or mated MATα/MATa cells could be distinguished from individual MATα (mCherry) or MATa (GFP) cells using flow cytometry. Shown scatter plot is an example of a reaction at ρT=0.3 and θα=0.5, with cell fluorescence expressed in arbitrary units (a.u.). Blue dots indicate mating pairs containing both GFP and mCherry. (b) Same reaction but with non-aggregating aga2Δ MATa cells shows only marginal appearance of mating pairs. (c) Fraction of wild-type MATa cells that became parts of aggregates as a function of θα at a fixed ρT=0.3 and at indicated time points. This fraction was determined as the number of MATa cells in aggregates divided by the total number of MATa cells. Error bars indicate the s.e.m. values of three independent replicates. Linear regression to the data (see Methods) at 259 min shows R2=0.9514. (d) Fraction of wild-type MATa cells that underwent mating as a function of θα at a fixed ρT=0.3 at 240 min. This fraction was determined using microscopy (see Supplementary Fig. 6) as the number of mated MATa cells divided by the total number of MATa cells. Error bars indicate the s.e.m. values of three independent replicates. Linear regression to the data shows R2=0.9688.

