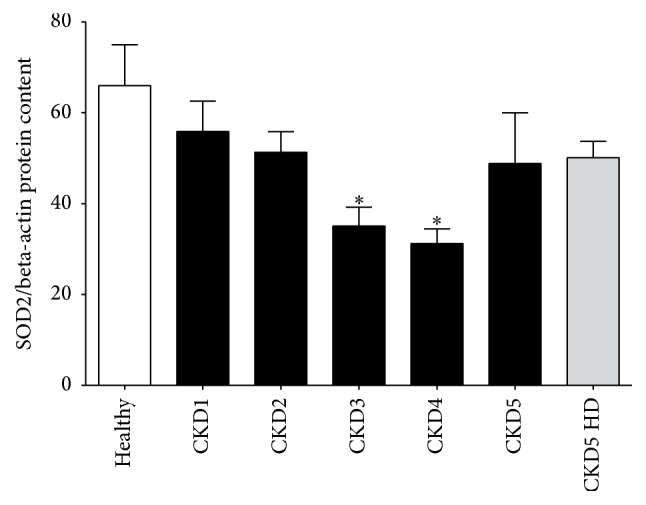
Figure 2.

J-shaped pattern of SOD2 protein content. Quantification of SOD2 protein content relative to housekeeping protein beta-actin by in-cell Western assays. The figure shows the comparison between healthy control subjects, patients with CKD stage 1 through 5, and hemodialysis patients (CKD5 HD); ∗ p < 0.05 compared to healthy controls by Dunn's multiple comparison posttest.
