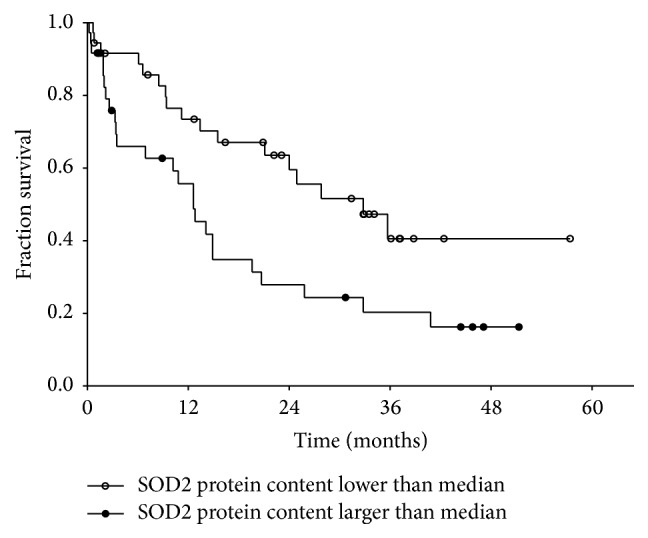
Figure 6.

Kaplan Meier survival curves of hemodialysis (CKD5 HD; n = 81) patients according to the SOD2 protein content in peripheral blood monocytes (Chi square, 6.25; p < 0.05 by log-rank test).

Kaplan Meier survival curves of hemodialysis (CKD5 HD; n = 81) patients according to the SOD2 protein content in peripheral blood monocytes (Chi square, 6.25; p < 0.05 by log-rank test).