Figure 3.

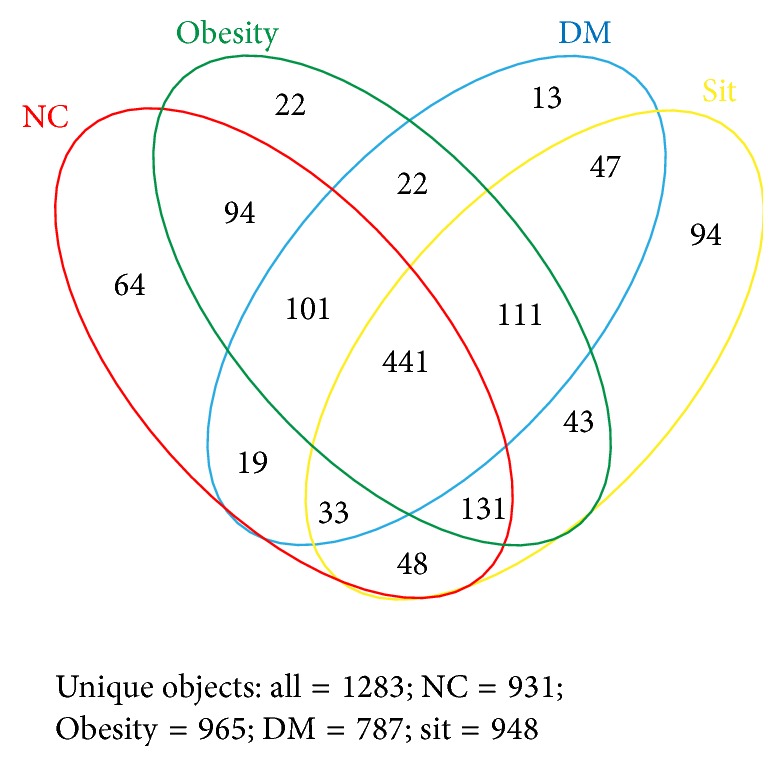
Shared OTU analysis of the different conditions. Venn diagram showing the unique and shared OTUs (3% distance level) in the different conditions.

Shared OTU analysis of the different conditions. Venn diagram showing the unique and shared OTUs (3% distance level) in the different conditions.