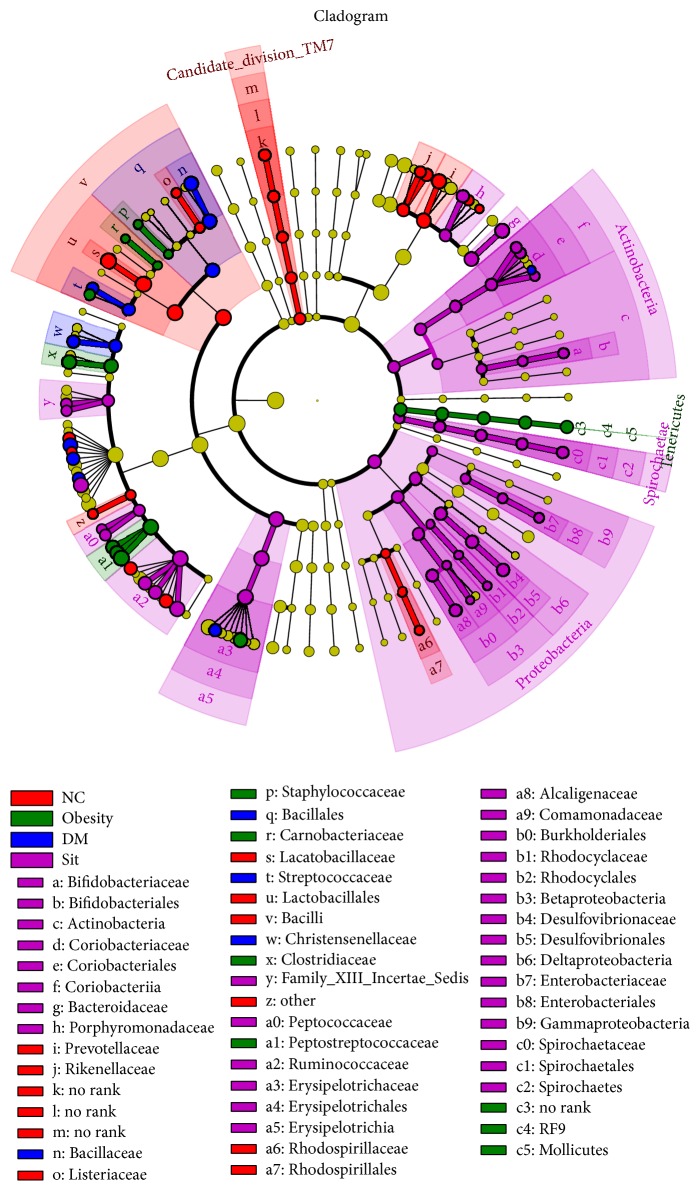
Figure 4.
Taxonomic representation of statistically and biologically consistent differences among condition normal, obesity, diabetes, and sitagliptin. Differences are represented by the color of the most abundant class (red indicating normal condition, green obesity condition, blue diabetes condition, purple sitagliptin condition, and yellow nonsignificance). The diameter of each circle is proportional to the taxon's abundance.

