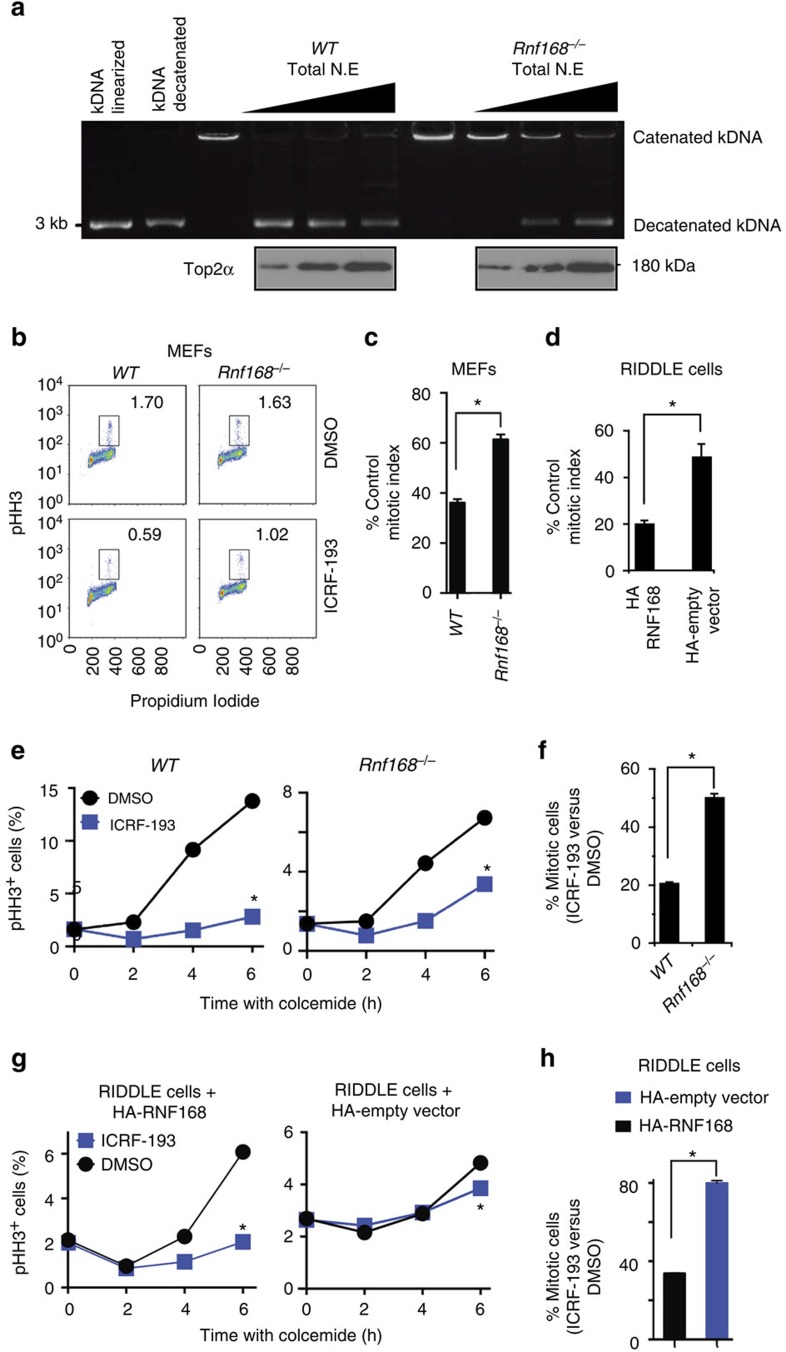
Figure 2. RNF168 stimulates DNA decatenation and is required for effective decatenation G2 checkpoint.
(a) Representative agarose gel of in vitro kinetoplast DNA-based decatenation assays performed for 10 min with different amount of nuclear extracts from WT and Rnf168−/− MEFs. Catenated and decatenated kDNA were separated by electrophoresis using 1% agarose gel. IB show Top2α's level in the total nuclear extracts used for this assay. (b) Representative data of the mitotic inhibition assay of decatenation G2 checkpoint in WT and Rnf168−/− primary MEFs. Cells were treated with DMSO or ICRF-193 for 15 min and then incubated in culture media for an additional 2 h. The fraction of mitotic cells (pHH3+) was determined by flow cytometry. (c) Bar graphs represent the mean inhibition of mitotic index 2 h post ICRF-193 treatment of passage 1 primary MEFs (% pHH3+ cells post ICRF-193 treatment compared with DMSO-treated controls). *P<0.05. (d) Bar graphs represent the mean inhibition of mitotic index 2 h post ICRF-193 treatment of RIDDLE cells reconstituted with either HA-RNF168 or HA-empty vector as in c. *P<0.05. (e) Analysis of decatenation G2 checkpoint of Rnf168−/− and WT 3T3 MEFs using the mitotic entry assay. Percentage of pHH3+ cells is shown at the indicated time post-treatment with colcemid in the presence of DMSO or ICRF-193. *P<0.05; Rnf168−/− MEFs compared with WT MEFs 6 h post-ICRF-193 treatment. (f) Bar graphs represent the mean fraction of pHH3+ WT and Rnf168−/− MEFs evading G2 arrest 6 h post-treatment with ICRF-193 compared with DMSO-treated cells as in e. *P<0.05. (g) Mitotic entry assay of decatenation G2 checkpoint in human RIDDLE cells reconstituted with HA-empty vector or HA-RNF168. Percentage of pHH3+ cells is shown at the indicated times post-treatment with colcemid with or without ICRF-193. *P<0.05, RIDDLE cells reconstituted with HA-empty vector compared with RIDDLE cells reconstituted with HA-RNF168 at 6 h post-ICRF-193 treatment. (h) Bar graphs represent the mean fraction of RIDDLE cells (reconstituted with HA-empty vector compared with those reconstituted with HA-RNF168) evading G2 arrest 6 h post ICRF-193 treatment compared with DMSO-treated controls as in f. *P<0.05. Three independent experiments in triplicates unless specified. Error bars in c,d,f and h represent mean±s.e.m.

