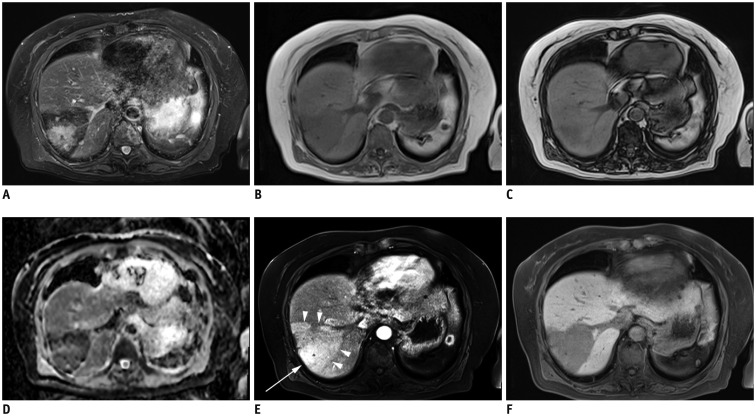
Fig. 2. MR images of liver.
A. Ill-defined hyperintense signal area was found in wedge-shaped dark signal intensity area on fat-suppressed T2WI. B-D. Signal intensity was lower on in-phase images (B) than on out-of-phase images (C) in area corresponding to ill-defined hyperintense signal on fat-suppressed T2WI. Surrounding area showed low signal due to iron deposition (D). On ADC map, restricted diffusion was absent. E. After Gd-EOB-DTPA injection, enhancement (arrow) was surrounded by wedge-shaped faint enhancement (arrowheads) on arterial phase. F. Well-defined wedge-shaped decrease in Gd-EOB-DTPA was found on hepatobiliary phase. ADC = apparent diffusion coefficient, Gd-EOB-DTPA = gadolinium-ethoxybenzyl-diethylenetriamine pentaacetic acid, T2WI = T2-weighted image

