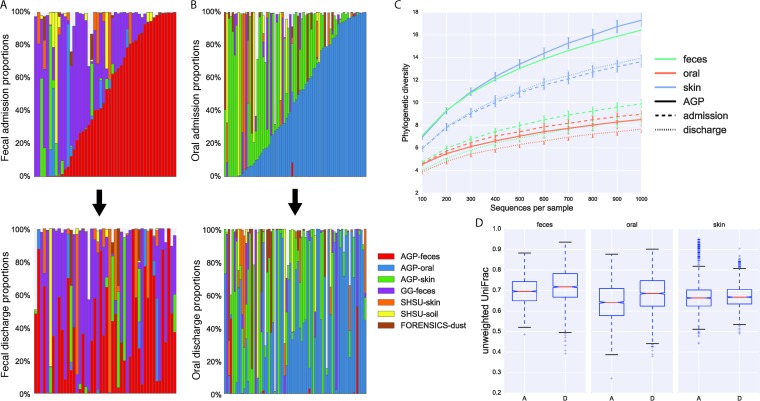
FIG 1 .
ICU stays result in drastic community changes. (A, B) SourceTracker proportions for ICU patients with samples obtained both at admission and at discharge in fecal (A) and oral (B) communities. The first row shows samples obtained at admission sorted by expected community type. The second shows samples obtained at discharge in patient order with the first row. Sources included samples from the healthy AGP subject subset, skin samples from decomposing bodies, soil samples from around decomposing bodies, fecal samples from healthy children in the Global Gut study, and dust samples from a house forensics study. A lack of color indicates an unknown source. For complete SourceTracker distribution plots, see Fig. S1 to 3 in the supplemental material. (C) Rarefaction curves using phylogenetic diversity of the ICU patient and healthy AGP subject samples. Error bars show standard errors. (D) Unweighted UniFrac distance distributions of within-time-point distances for fecal (P = 1.24e−28; Bonferroni corrected), oral (P = 1.75e−71; Bonferroni corrected), and skin (no significant difference) sites. The letters A and D on the x axis denote admission and discharge, respectively; whiskers are at 1.5 times the interquartile range. For a comparable weighted UniFrac analysis, see Fig. S4 in the supplemental material.

