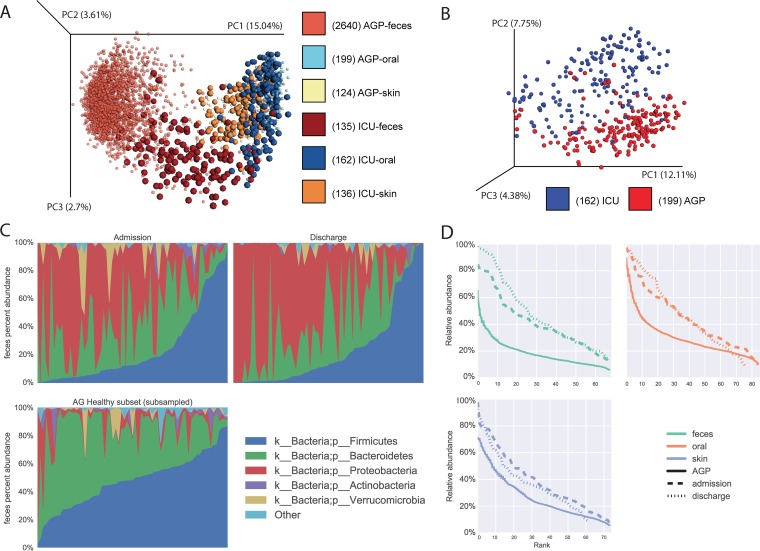
FIG 2 .
ICU patients differ markedly from healthy AGP subjects. (A, B) Principal-coordinate (PC) plots of unweighted UniFrac distances of both ICU patient and healthy AGP subject samples: A, fecal, skin, and oral samples with the ICU patient samples enlarged to aid in differentiation; B, oral samples in isolation. (C) Stacked taxonomy bar charts for fecal split by time point, showing a random subsample of healthy AGP subject samples. (D) Rank-abundance curves for all three body sites split by time point, showing random subsamples from the healthy AGP subject subset.

