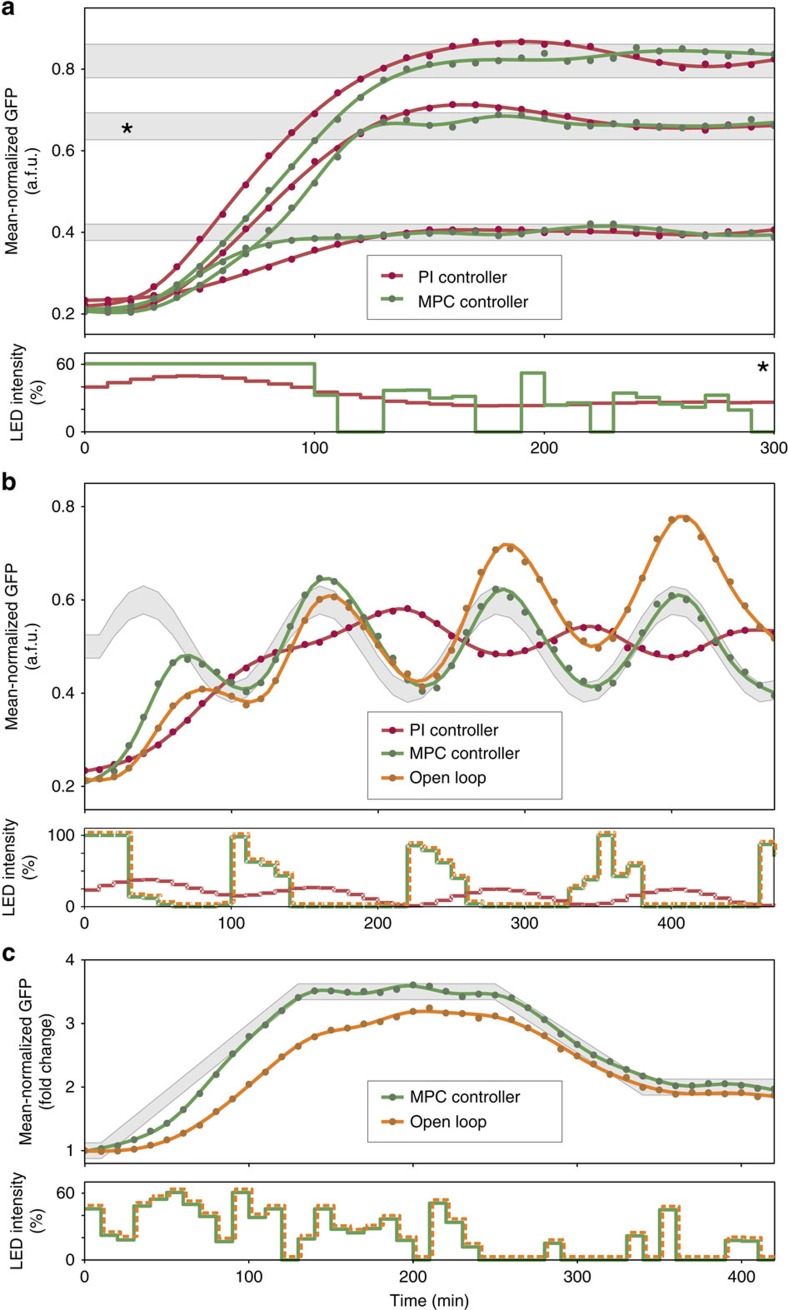
Figure 2. Tracking of reference sfGFP expression trajectories.
Dots denote sfGFP measurements, lines are polynomial fits. (a) Constant reference tracking: for each constant reference level, a PI and an MPC controller were used. Grey bands determine a tolerance margin around each setpoint (±5% of the target level). It should be noted that MPC responses achieve the target (that is, stay inside the grey band) much earlier than PI responses. The applied green light inputs, expressed as a percentage of the maximum green LED intensity, are shown for the starred reference. All applied light inputs can be found in Supplementary Note 5. The maximum allowable LED intensity for MPC was limited to 60% since the dose-response curve (Supplementary Note 11) of the system is almost flat above this level. PI gains were set to KP=80 and KI=8. (b) Tracking of a sinusoidal reference: since the reference varies relatively fast with respect to the intrinsic timescales of the system, tracking is impossible for the PI controller (gains as in a). On the other hand, MPC control was still capable of excellent tracking. The grey band denotes a tolerance margin around the reference trajectory (±5% of the reference curve). To determine the repeatability of open-loop input application, the MPC input profile (green line) was applied to a culture grown on a different day, using the same growth protocol and conditions. Day-to-day variability in the dynamical behaviour of the culture is manifested in the deviation of the dark-grey response from the reference trajectory. (c) Tracking of a piecewise linear reference: PI control is known to generate a constant steady-state tracking error for linearly increasing inputs25 (unless the controlled system behaves like an integrator by itself), and was therefore not tested. MPC again achieved very good tracking (grey band depicts ±5% of the final constant level). Repetition of the MPC input profile (green line) on a different day, resulted in the dark-grey response.

