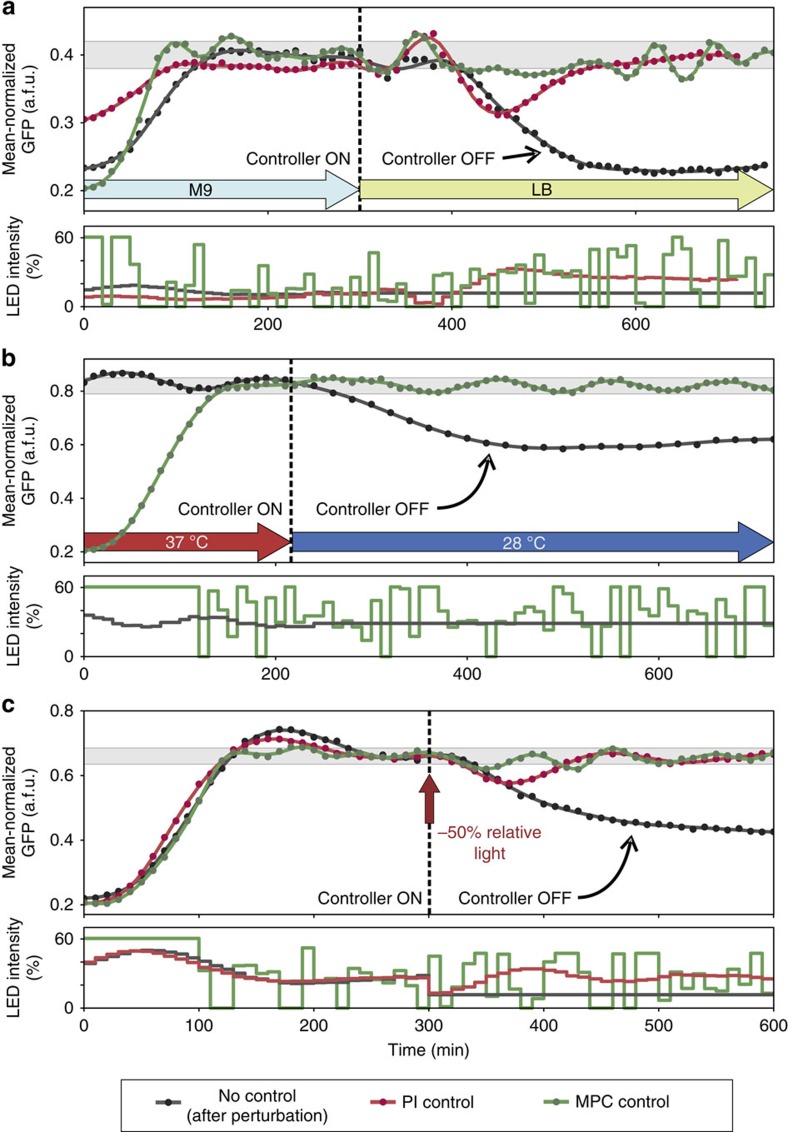
Figure 3. Rejection of large disturbances to the cell culture.
Dots denote sfGFP measurements, lines are polynomial fits. In all panels, the grey band corresponds to ±5% of the target expression level. Each curve corresponds to a culture started on a different day. Wherever applicable, the PI gains were set to KP=80 and KI=8 from the beginning of each experiment up to an hour before the perturbation. At this point, they were changed to to KP=160 and KI=20 and the cultures were maintained for an additional hour at the same reference before the disturbance was applied. (a) A change of culture medium: the turbidostat feed was switched from M9 to LB at the 5 h mark, inducing a large perturbation to the culture. Day-to-day variability in controlled system dynamics led to a long transient phase for the red curve. The first part of this response is therefore not shown. For the dark-grey response we used a PI controller during the M9 phase, and switched it off after the shift, keeping the light input constant at the pre-shift level. (b) A decrease in culture temperature: for the dark-grey response we used a PI controller during the 37 °C phase to achieve the desired sfGFP fluorescence. The transient phase of the PI response is not shown on the plot. The PI controller was switched off after the cells were taken out of the heat bath and light input was kept constant at the pre-shift level. (c) An input perturbation: after 5 h into the experiment and until the end, the green light input was reduced by subtracting 50% of the PI input at 5 h, to mimic a damage in the light-delivery system. For the dark-grey response we used a PI controller during the first 5 h, and switched it off after the perturbation, keeping the light input constant at the reduced level.

