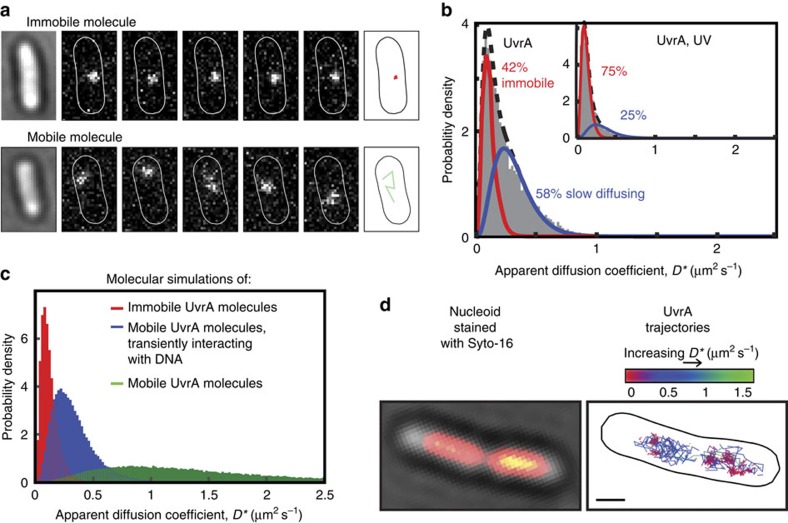
Figure 1. In vivo characterization of UvrA.
(a) Example image of a single immobile UvrA-PAmCherry molecule imaged, localized and tracked at 15 ms exposures over five consecutive frames (top). Example consecutive images showing fast diffusing UvrB-PAmCherry molecule (bottom). (b) Distribution of apparent diffusion coefficients (D*) of 8,720 tracked UvrA molecules, fitted with a two species model; an immobile, DNA-bound population (42%±2%, error indicates s.e.m. of three experimental repeats; constrained at Dimm=0.11 μm2 s−1) and a mobile population of slowly moving molecules (58%±2%; unconstrained fit converged to Dslow=0.31±0.01 μm2 s−1, D value range represents 95% confidence intervals). (Inset) Distribution of D* values of 6,941 tracked UvrA molecules after exposure to 50 J m−2 ultraviolet light (UV), fitted with a two species model. (c) Distribution D* values of trajectories generated from Monte Carlo diffusion simulations within a typical E. coli cell volume. Each simulated trajectory is averaged over 15 ms frame times and 40 nm localization uncertainty added, and the resulting localizations analysed as for experimental data. The D* distribution for simulated immobile molecules is shown in red, and the distribution of D* values expected for freely diffusing UvrA dimers is shown in green. The D* distribution generated from simulations of molecules rapidly interconverting between free diffusion and transient DNA binding is shown in blue (see Supplementary Methods for details). (d) Imaging of UvrA molecules and Syto-16-stained DNA in the same cells. To increase nucleoid-free regions, cells were treated with nucleoid-compacting antibiotic chloramphenicol. For analysis of >100 unperturbed cells, and cells after UV exposure, see Supplementary Fig. 1e. Scale bar, 1 μm.

