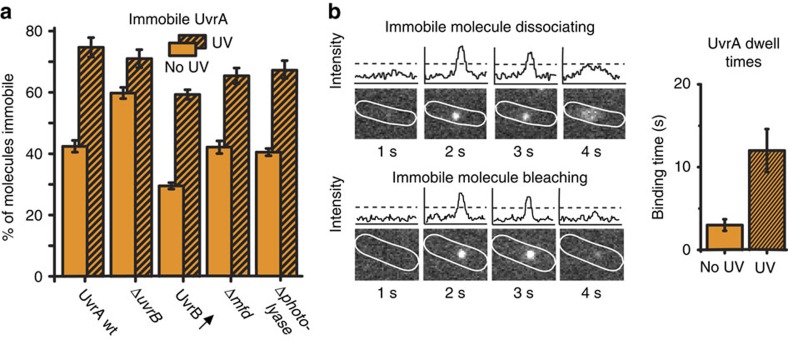
Figure 2. Immobile UvrA molecules.
(a) Fractions of immobile UvrA molecules extracted by fitting two species model to the UvrA D* distribution before and after exposure to ultraviolet light (UV) in WT cells, ΔuvrB cells, cells overexpressing unlabelled UvrB from a plasmid, Δmfd and Δphotolyase cells. Errors represent s.e.m. of three experimental repeats. See Supplementary Fig. 2 for fitted D* distributions. (b) Dwell time assay. Example cells imaged with 1 s exposures, showing an immobile, DNA-bound UvrA molecule and the corresponding intensity. The UvrA molecule dissociates from DNA (left, top), or is photobleached before dissociation (left, bottom). Photobleaching lifetimes were measured independently in fixed cells, and used to correct for the effects of truncation by photobleaching; see Methods. Binding time distributions for immobile UvrA±UV exposure after correction for photobleaching in WT cells (right). UvrA-binding times were measured with 1 s exposures. See Supplementary Fig. 3 for fitted distributions.

