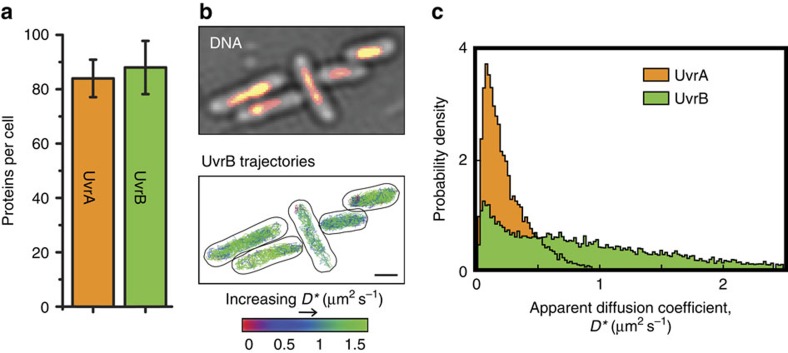
Figure 3. UvrA and UvrB have a different mobility and distribution in cells.
(a) Mean copy numbers for UvrA and UvrB monomers from >500 cells. No damage was introduced. Errors indicate s.e.m. of three experimental repeats. (b) Imaging of UvrB molecules and Syto-16-stained DNA in the same cells. Image represents conditions without introduction of damage. To increase nucleoid-free regions, cells were treated with nucleoid-compacting antibiotic chloramphenicol. Scale bar, 1 μm. For analysis of >100 cells without chloramphenicol treatment, both before and after exposure to ultraviolet light, see Supplementary Fig. 1e. (c) Overlay of UvrA and UvrB D* distributions.

