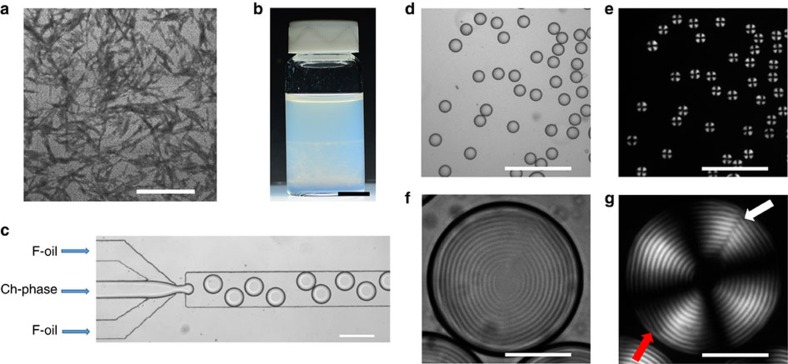
Figure 1. Generation of droplets by microfluidic emulsification of the Ch–CNC suspension.
(a) TEM images of dried CNCs. The scale bar is 500 nm. (b) Phase separation of the macroscopic CNC suspension into a Ch phase (bottom) and an isotropic phase (top). The scale bar is 1 cm. (c) Optical microscopy image of microfluidic generation of droplets of the Ch–CNC phase. The flow rate of F-oil and the Ch–CNC phase were 0.8 and 0.2 ml h−1, respectively. The scale bar is 250 μm. (d,f) Bright-field (BF) optical microscopy images and (e,g) corresponding polarized optical microscopy (POM) images of Ch-CNC droplets with φ0=0.048. Scale bars are 500 μm (d,e) and 50 μm (f,g). Arrows in g show the radial disclination line defect running perpendicularly to the Ch layers (white arrow) and an edge dislocation running parallel to the Ch layers (red arrow).

