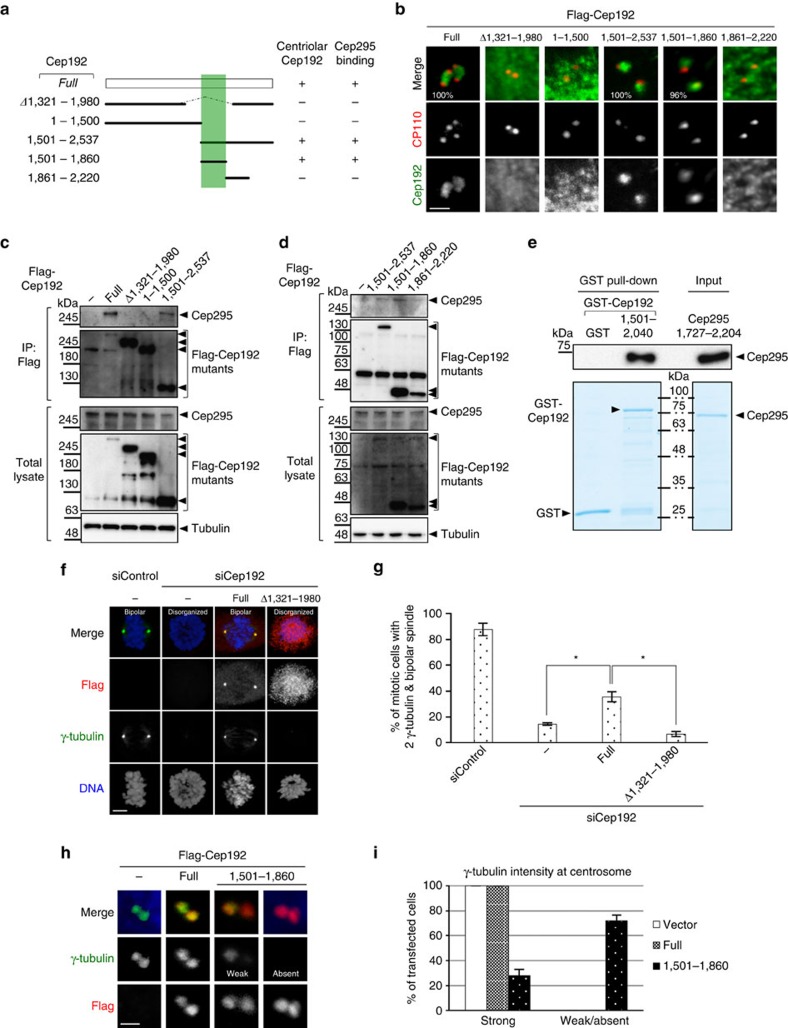
Figure 6. Interaction between Cep295 and Cep192 is required for centriolar localization of Cep192.
(a) Schematic of full-length Cep192 and the deletion mutants used for co-IP assays with endogenous Cep295 in U2OS cells. The minimal Cep295-binging region in Cep192 is represented in grey. (b) U2OS cells were transfected with Flag-Cep192 full-length and the indicated mutants. The cells were stained with antibodies against Cep192 (green) and CP110 (red). Scale bar, 1 μm. (c,d) U2OS cells expressing Flag-Cep192 full length or the deletion mutant proteins were immunoprecipitated with FLAG beads. Total cell lysates and IPs were analysed by western blotting using Cep295, Flag or tubulin antibodies. (e) GST pull-down assay showing the interaction between Cep295 and Cep192 fragments (aa 1727–2204 of Cep295 and aa 1501–2040 of Cep192) in vitro. These bacterially purified recombinant proteins contain the interacting regions that were identified by co-immunoprecipitation experiments. (f,g) For rescue experiments, Cep192-depleted U2OS cells were transfected with RNAi-resistant full-length Cep295 and the indicated mutant. Scale bar, 5 μm. Histograms represent frequency of bipolar mitotic spindles with the indicated number of γ-tubulin foci. Values are mean percentages±s.e.m from three independent experiments (N=30 for each condition). *P<0.05 (two-tailed t-test). (h,i) Dominant negative effects of the Cep192 fragment that binds to Cep295. U2OS cells were transfected with full-length Cep295 and the indicated mutant. Scale bar, 1 μm. Histograms represent frequency of transfected cells with the indicated intensity of γ-tubulin foci. Values are mean percentages±s.e.m from three independent experiments (N=30 for each condition). **P<0.01 (two-tailed t-test).

