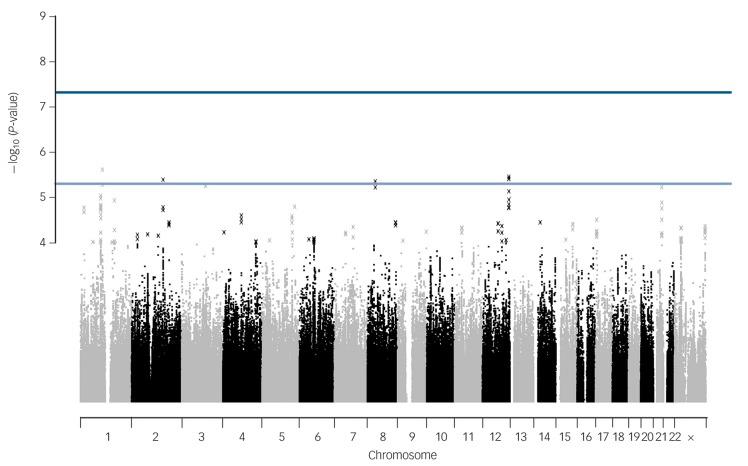
Fig. 1.
Manhattan plot of genetic associations with cognitive–behavioural therapy response baseline to post-treatment.
X-axis shows the top million most associated single nucleotide polymorphisms, arranged by position on the chromosome. Lines show conventional thresholds for genome-wide significance (P = 5 × 10⁻⁸) and suggestive significance (P = 5 × 10⁻⁶).

