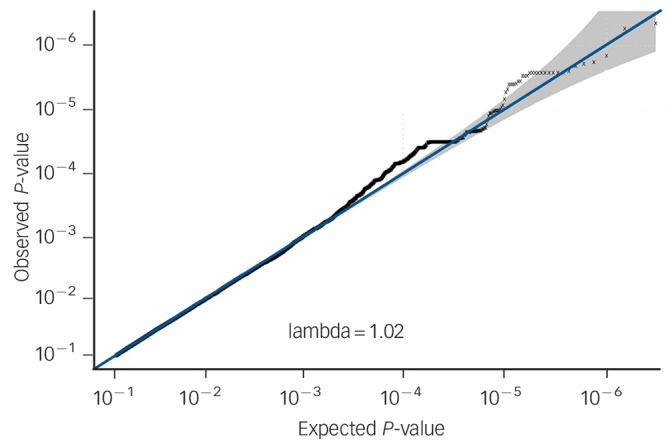
Fig. 4.

Quantile–quantile plot of P-values from genetic associations with cognitive–behavioural therapy response baseline to 6-month follow-up, including lambda median.

Quantile–quantile plot of P-values from genetic associations with cognitive–behavioural therapy response baseline to 6-month follow-up, including lambda median.