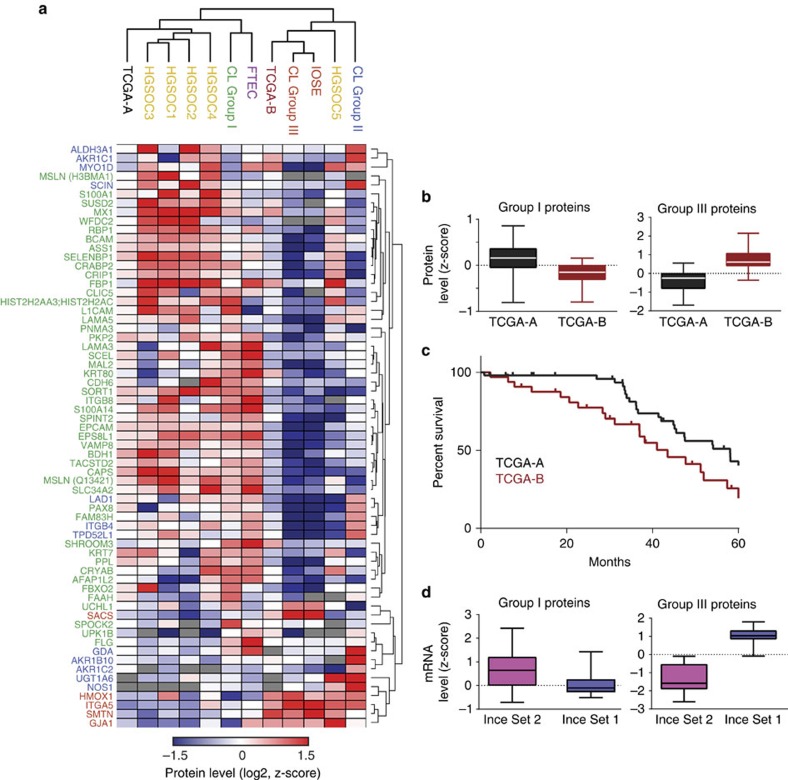
Figure 5. Clustering of the TCGA tumours based on the 67-protein cell line signature.
Hierarchical clustering summary of 84 TCGA tumours with the cell lines, FTECs, IOSEs and HGSOC-1 to -5. (a) Hierarchical clustering based on the 67-protein signature was applied to the publically available proteomic profiles of 84 TCGA tumours, and our own data set comprises the cell lines, FTECs, IOSEs and HGSOC-1 to -5 (Supplementary Fig. 5). The average protein levels for each sample group are shown. (b) Group I and group III proteins are higher in TCGA-A and TCGA-B tumours, respectively. Z-scored protein levels of group I and group III proteins were plotted as box plots for TCGA-A and TCGA-B tumours. (c) TCGA-B tumours (maroon line) are associated with a poorer overall survival compared with TCGA-A tumours (black line). Kaplan–Meier overall survival curves were plotted for patients in TCGA-A or TCGA-B. Survival associated with TCGA-B was significantly lower than that associated with TCGA-A (43.5 months versus 58 months, Mantel–Cox P value=0.0048). (d) The mRNA levels of group I and group III proteins were analysed in a publically available mRNA data set containing two different primary ovarian cancer cell line clusters35. Box plots show higher median mRNA levels of group I proteins in the favourable (Ince Set 2) and relatively lower in the unfavourable (Ince Set 1) survival-associated sets, while the converse is true for group III proteins.

