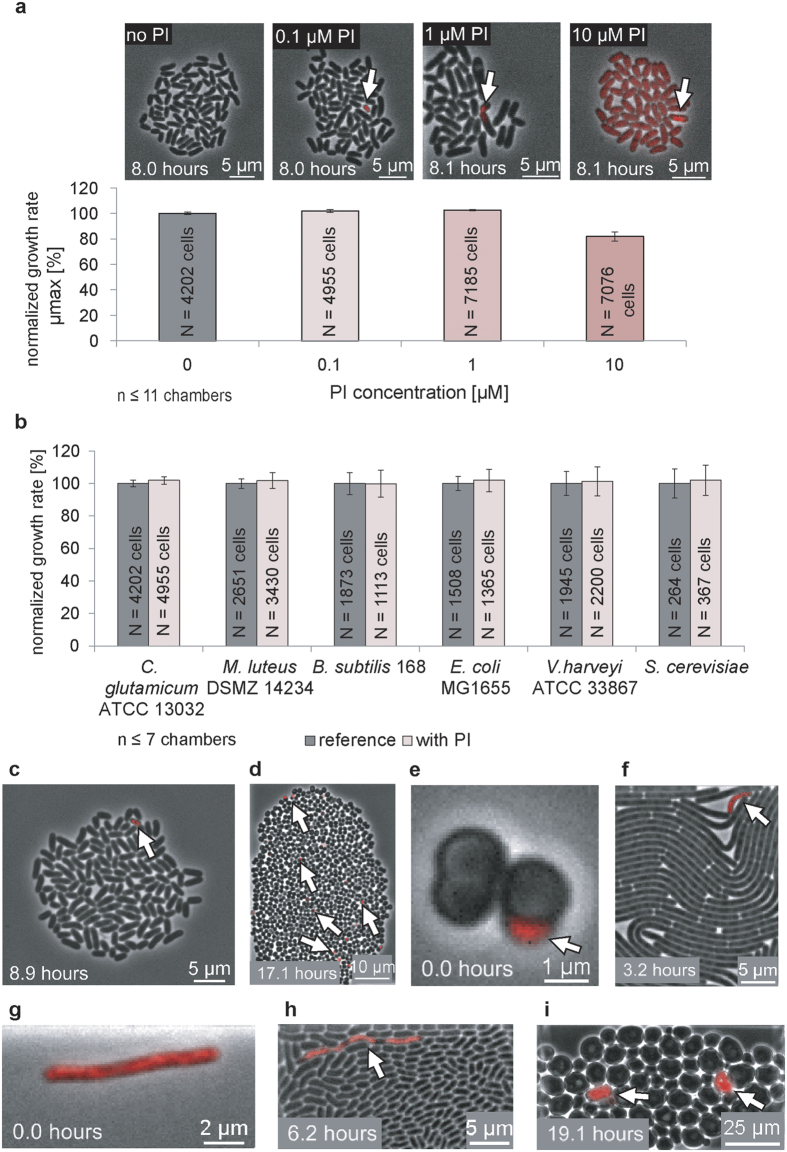
Figure 1. Determination of optimal propidium iodide concentration.
(a) The model organism Corynebacterium glutamicum was stained continuously with 0.1 μM PI, 1 μM PI, and 10 μM PI, and bacterial growth was normalized to the growth rate without PI addition. Total cell numbers are indicated with N. PI+ dead cells are marked by white arrows. (b) A PI concentration of 0.1 μM was used with Gram-positive bacteria (C. glutamicum ATCC 13032, Micrococcus luteus DSMZ 14234 and Bacillus subtilis 168), Gram-negative bacteria (Escherichia coli MG1655 and Vibrio harveyi ATCC 33867), and a small eukaryote (Saccharomyces cerevisiae). The growth rates of all microorganisms cultivated with 0.1 μM PI were normalized and compared to reference colonies grown without PI. Total cell numbers are given by N. (c) C. glutamicum ATCC 13032 colony with a single PI+ cell. (d) M. luteus DSMZ 14234 colony in the late exponential phase with distributed PI+ cocci. (e) M. luteus DSMZ 14234 tetrad with the early appearance of a PI+ cell. (f) Densely grown B. subtilis 168 cell colony with the late appearance of a PI+ cell. (g) Early appearance of a PI+ E. coli MG1655 cell. (h) Segmented V. harveyi ATCC 33867 PI+ phenotype in a cell-packed region. (i) Dense S. cerevisiae colony with PI+ yeast cells.

