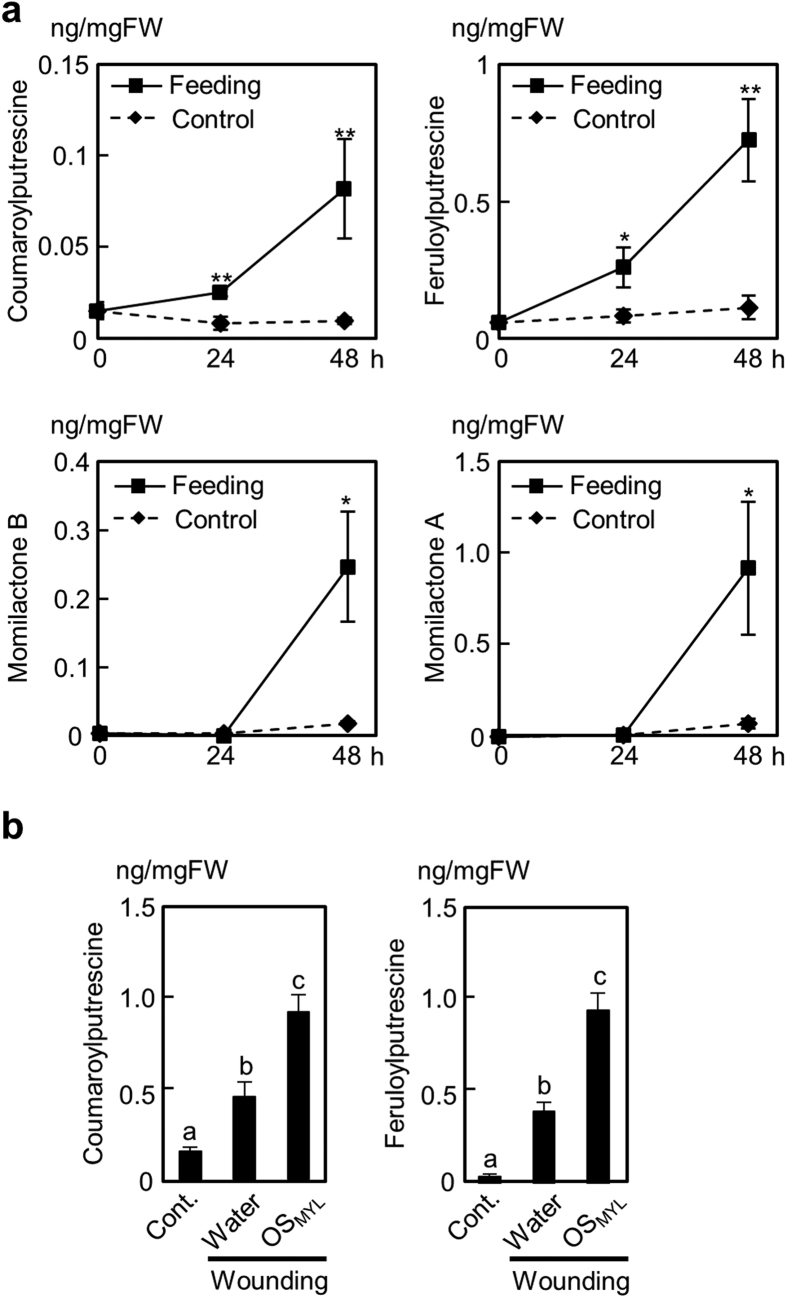
Figure 1. Metabolite accumulation induced by M. loreyi feeding and oral secretions in rice leaves.
(a) M. loreyi feeding-induced metabolite accumulation in rice was determined by LC-MS/MS after 0, 1 and 2 d herbivore exposure. Data (n = 4–5) are shown as means ± SE, and asterisks show statistically significant differences between treated and control samples at each time point determined by Student t-test (**P < 0.01; *P < 0.05). (b) Rice leaves were wounded with a fabric pattern wheel, and immediately treated with 20 μL of water, or 20 μL of M. loreyi oral secretions (OSMYL, 3-fold dilution). Metabolite levels were measured 24 h after plant treatments. Data (n = 4–5) are shown as means ± SE, and statistical differences were analyzed by ANOVA followed by Tukey HSD test (P < 0.05).

