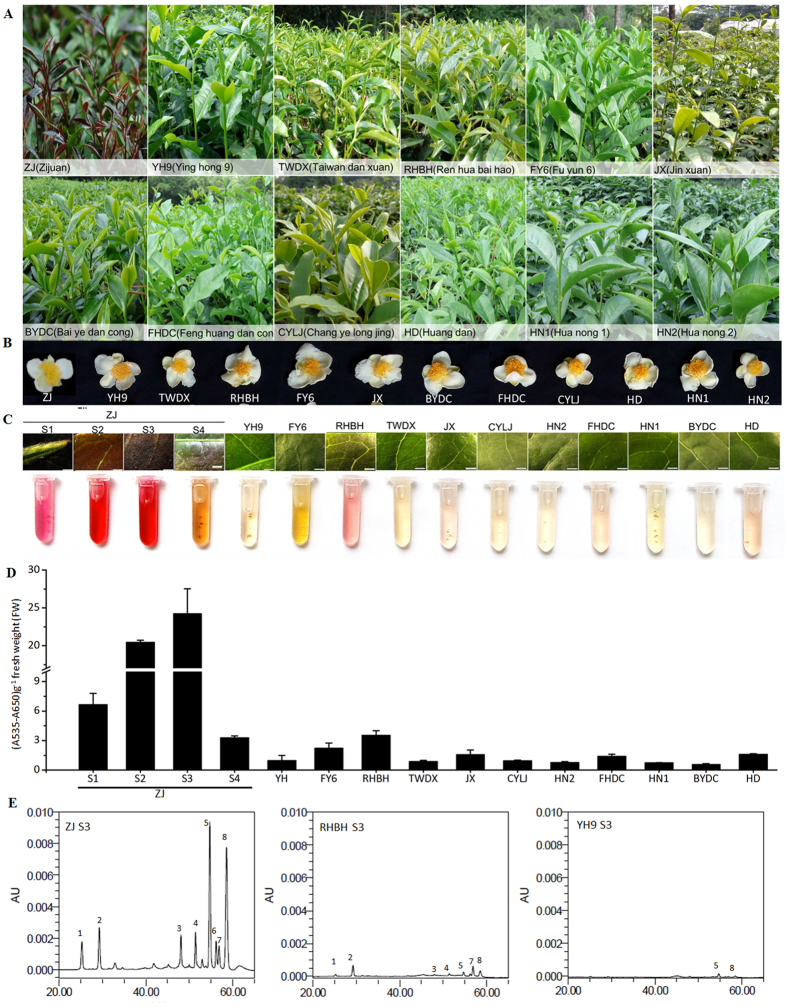
Figure 1. Analysis of anthocyanin content in different C. sinensis cultivars.
Phenotypes of C. sinensis leaves (A) and flowers (B). (C) Close-up of purple foliage cultivar ‘Zijuan’ (‘ZJ’) leaf in stages S1, S2, S3 and S4 and green foliage cultivars leaves in stage S3 and corresponding extraction of anthocyanin. Bar = 1 mm. S1, bud; S2, 7 days after budding (DAB); S3, 15 DAB; S4, 40 DAB. (D) Analysis for anthocyanin as shown in (C). Error bars on each symbol indicate the mean ± SD of three biological repeats. (E) HPLC traces at 520 nm of red and evergreen foliage cultivars ‘ZJ’, ‘RHBH’ and ‘YH9’ in stage S3 leaves. 5, cyanidin-3-O-galactoside, 8, delphinidin-3-O-galactoside.

