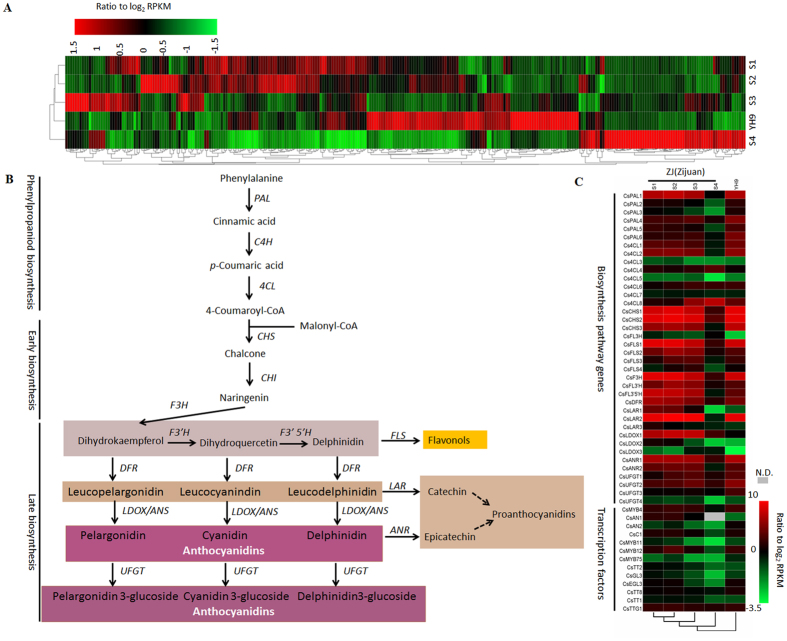
Figure 2. Analysis of transcription data obtained from C. sinensis cultivars ‘ZJ’ and ‘YH9’.
(A) Hierarchical clustering analysis of 308 phenylpropanoid and flavonoid pathway related transcripts unigenes based on RNA-seq profiles data. (B) Simplified model of the flavonoid biosynthetic pathway in tea plant. (C) Phenylpropanoid and flavonoids pathway with related transcripts present in ‘ZJ’ and ‘YH9’, respectively. N.D., undetected.

