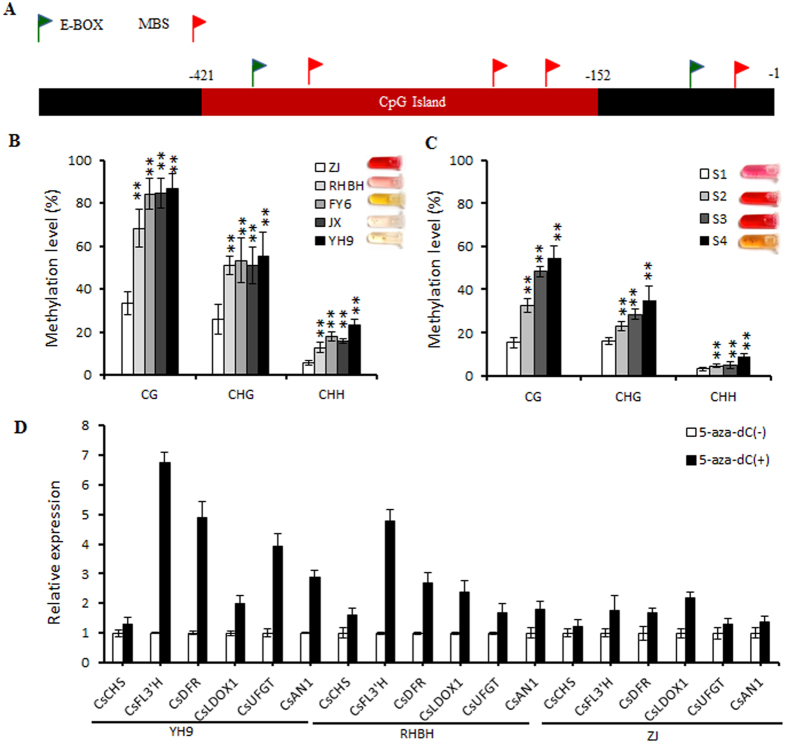
Figure 7. DNA methylation analysis of the CsAN1 promoter.
(A) Schematic representation of CsAN1 promoter. Red box indicate CpG island. (B) DNA methylation status of bisulfite-sequenced CpG island in five tea cultivars and (C) ‘ZJ’ leaf at four developmental stages. CG, CHG and CHH refer to the three different contexts of cytosines, in which H represents nucleotide A, C or T. Each data point represents a mean ± SD of three independent gDNA extractions with three independent technical replicates. Five independent clones from each reaction were sequenced and analyzed. (D) Real-time reverse transcription-PCR analyses of CsAN1 and anthocyanin biosynthesis related genes expression in ‘YH9’, ‘RHBH’ and ‘ZJ’ leaves treated with (+) or without (−) 5-aza-dC, an inhibitor of DNA methylation. Tea Actin was used as a control. Values are means ± SD of three biological replicates. Asterisks indicate significant differences (p < 0.01) by Student’s t-test.

