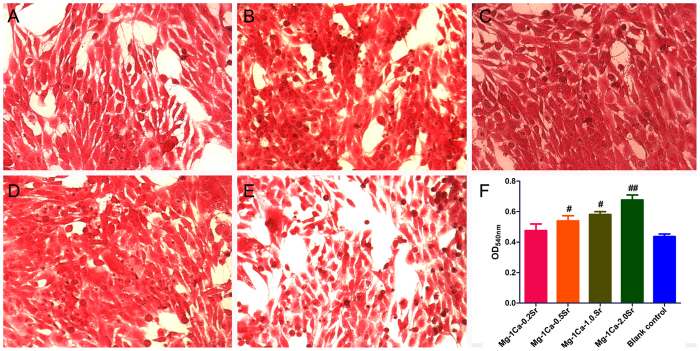
Figure 7.
The collagen secretion was stained by Sirius Red (A) Mg-1Ca-0.2Sr alloy, (B) Mg-1Ca-0.5Sr alloy, (C) Mg-1Ca-1.0Sr alloy, (D) Mg-1Ca-2.0Sr alloy, (E) Control group) and quantified using a colorimetric method (F) after osteoinduction for 14 days. Cells cultured in osteogenic medium were set as the blank control group. All data represent the mean ± standard deviation of three independent experiments. #p < 0.05 and ##p < 0.01 compared with the blank control group.

