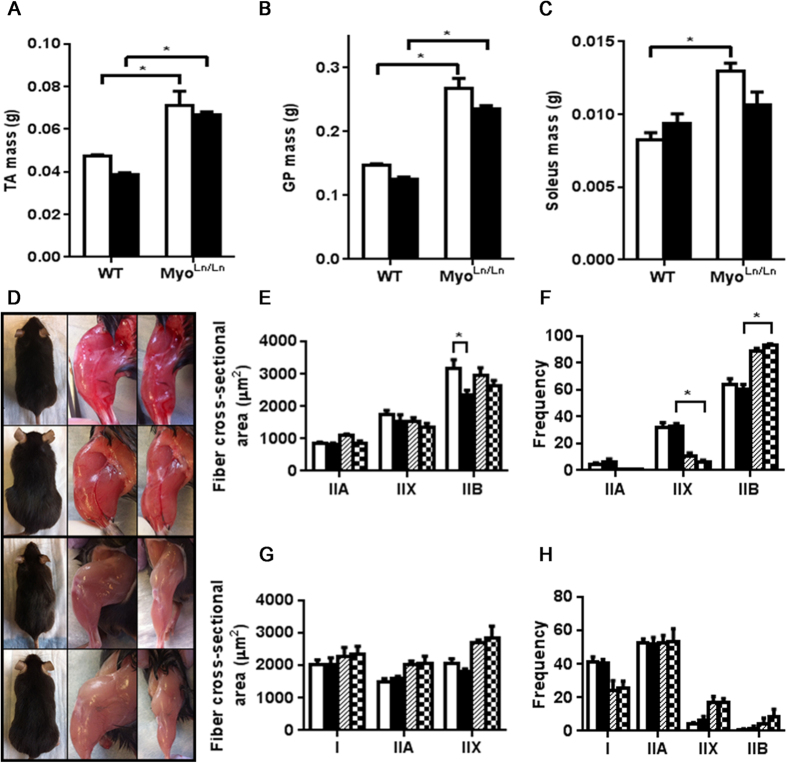
Figure 2. Muscles of MyoLn/Ln animals are much larger than those with normal myostatin expression.
Diabetic MyoLn/Ln animals have significantly larger muscles than those of the Akita mouse. (A) TA mass at 12 weeks of age. N = 5–11.(B) GP mass at 12 weeks of age. N = 5–8. (C) Soleus mass at 12 weeks of age. N = 4–8. (D) Pictures of mouse cohorts. Top panels – WT. Second from top – MyoLn/Ln. Second from bottom – Diabetic; bottom – MyoLn/Ln Diabetic. (E) TA cross-sectional area N = 3–4. White bar – WT, black bar – diabetic, hatched bar - MyoLn/Ln, checkered – MyoLn/Ln diabetic. (F) TA fiber type proportion. N = 4. (G) Soleus cross-sectional area. Note: The number of IIB fibers was too few within the soleus to compare cross-sectional area (some sections had no IIB fibers). N = 3–4. (H) Soleus fiber type proportion. N = 3–4. For all graphs two-way ANOVA with Bonferroni post-hoc test was performed. *Indicates p < 0.05.

